
INTRODUCTION
The wide spread of metallurgical production results in elevated levels of environmental pollution. The harmful action of pollutants not only affects the factory workers, but also the population of nearby settlements. For these reasons, it is a vital task to investigate the mechanisms of toxicants action. Information about these mechanisms could be useful for the development of new diagnostic and therapeutic methods. Lead is the most common environmental toxicant. This metal can be found everywhere, both in organic and in inorganic materials. Sources of lead pollution can arise from natural deposits and human activities – these may be factory emissions from using lead accumulators and leaded gas1-3. Lead is a heavy metal without known biological functions. As an ion, Pb+2, lead is similar to calcium, zinc and iron ions by its dimensional and charge characteristics – so a competition between these substances occurs that leads to disturbances in metabolic pathways, connected with these elements4-8. Moreover, lead possesses great affinity for sulfur and may deactivate thiol-containing biomolecules fully or partially. Negative effects of lead exposure are known. These include anemia, porphyria, glucosuria, hypophosphatemia, and aminoaciduria9,10. Neurological disorders after chronic lead exposure include children’s growth delay, intelligence reduction, memory degradation, hearing loss, and brain damage11,12. There are existing metabolomic investigations on lead action in humans. Changes in metabolism of amino acids, urea and porphirines were observed in a urine metabolomic study for people who live near a lead-battery recycling plant9. Also, it was established, through a blood metabolomic experiment, that lead-associated chronic diseases imply changes in metabolism of amino acids, xenobiotics, lipids, energetical exchange metabolites, and peptides13. The aim of the present work is to ascertain blood metabolites that change expression under lead exposure in a subchronical experiment with intraperitoneal injection, and to review these functions in the context of lead intoxication. In the study were discovered changes in the expression of such compounds as long- and middle-chain acylcarntitines, phosphatidylserine, hydroxy- and epoxy-PUFA derivatives – these facts may provide evidence about disturbances in the lipid oxidation process, inflammation and intensification of apoptotic processes.
METHODS
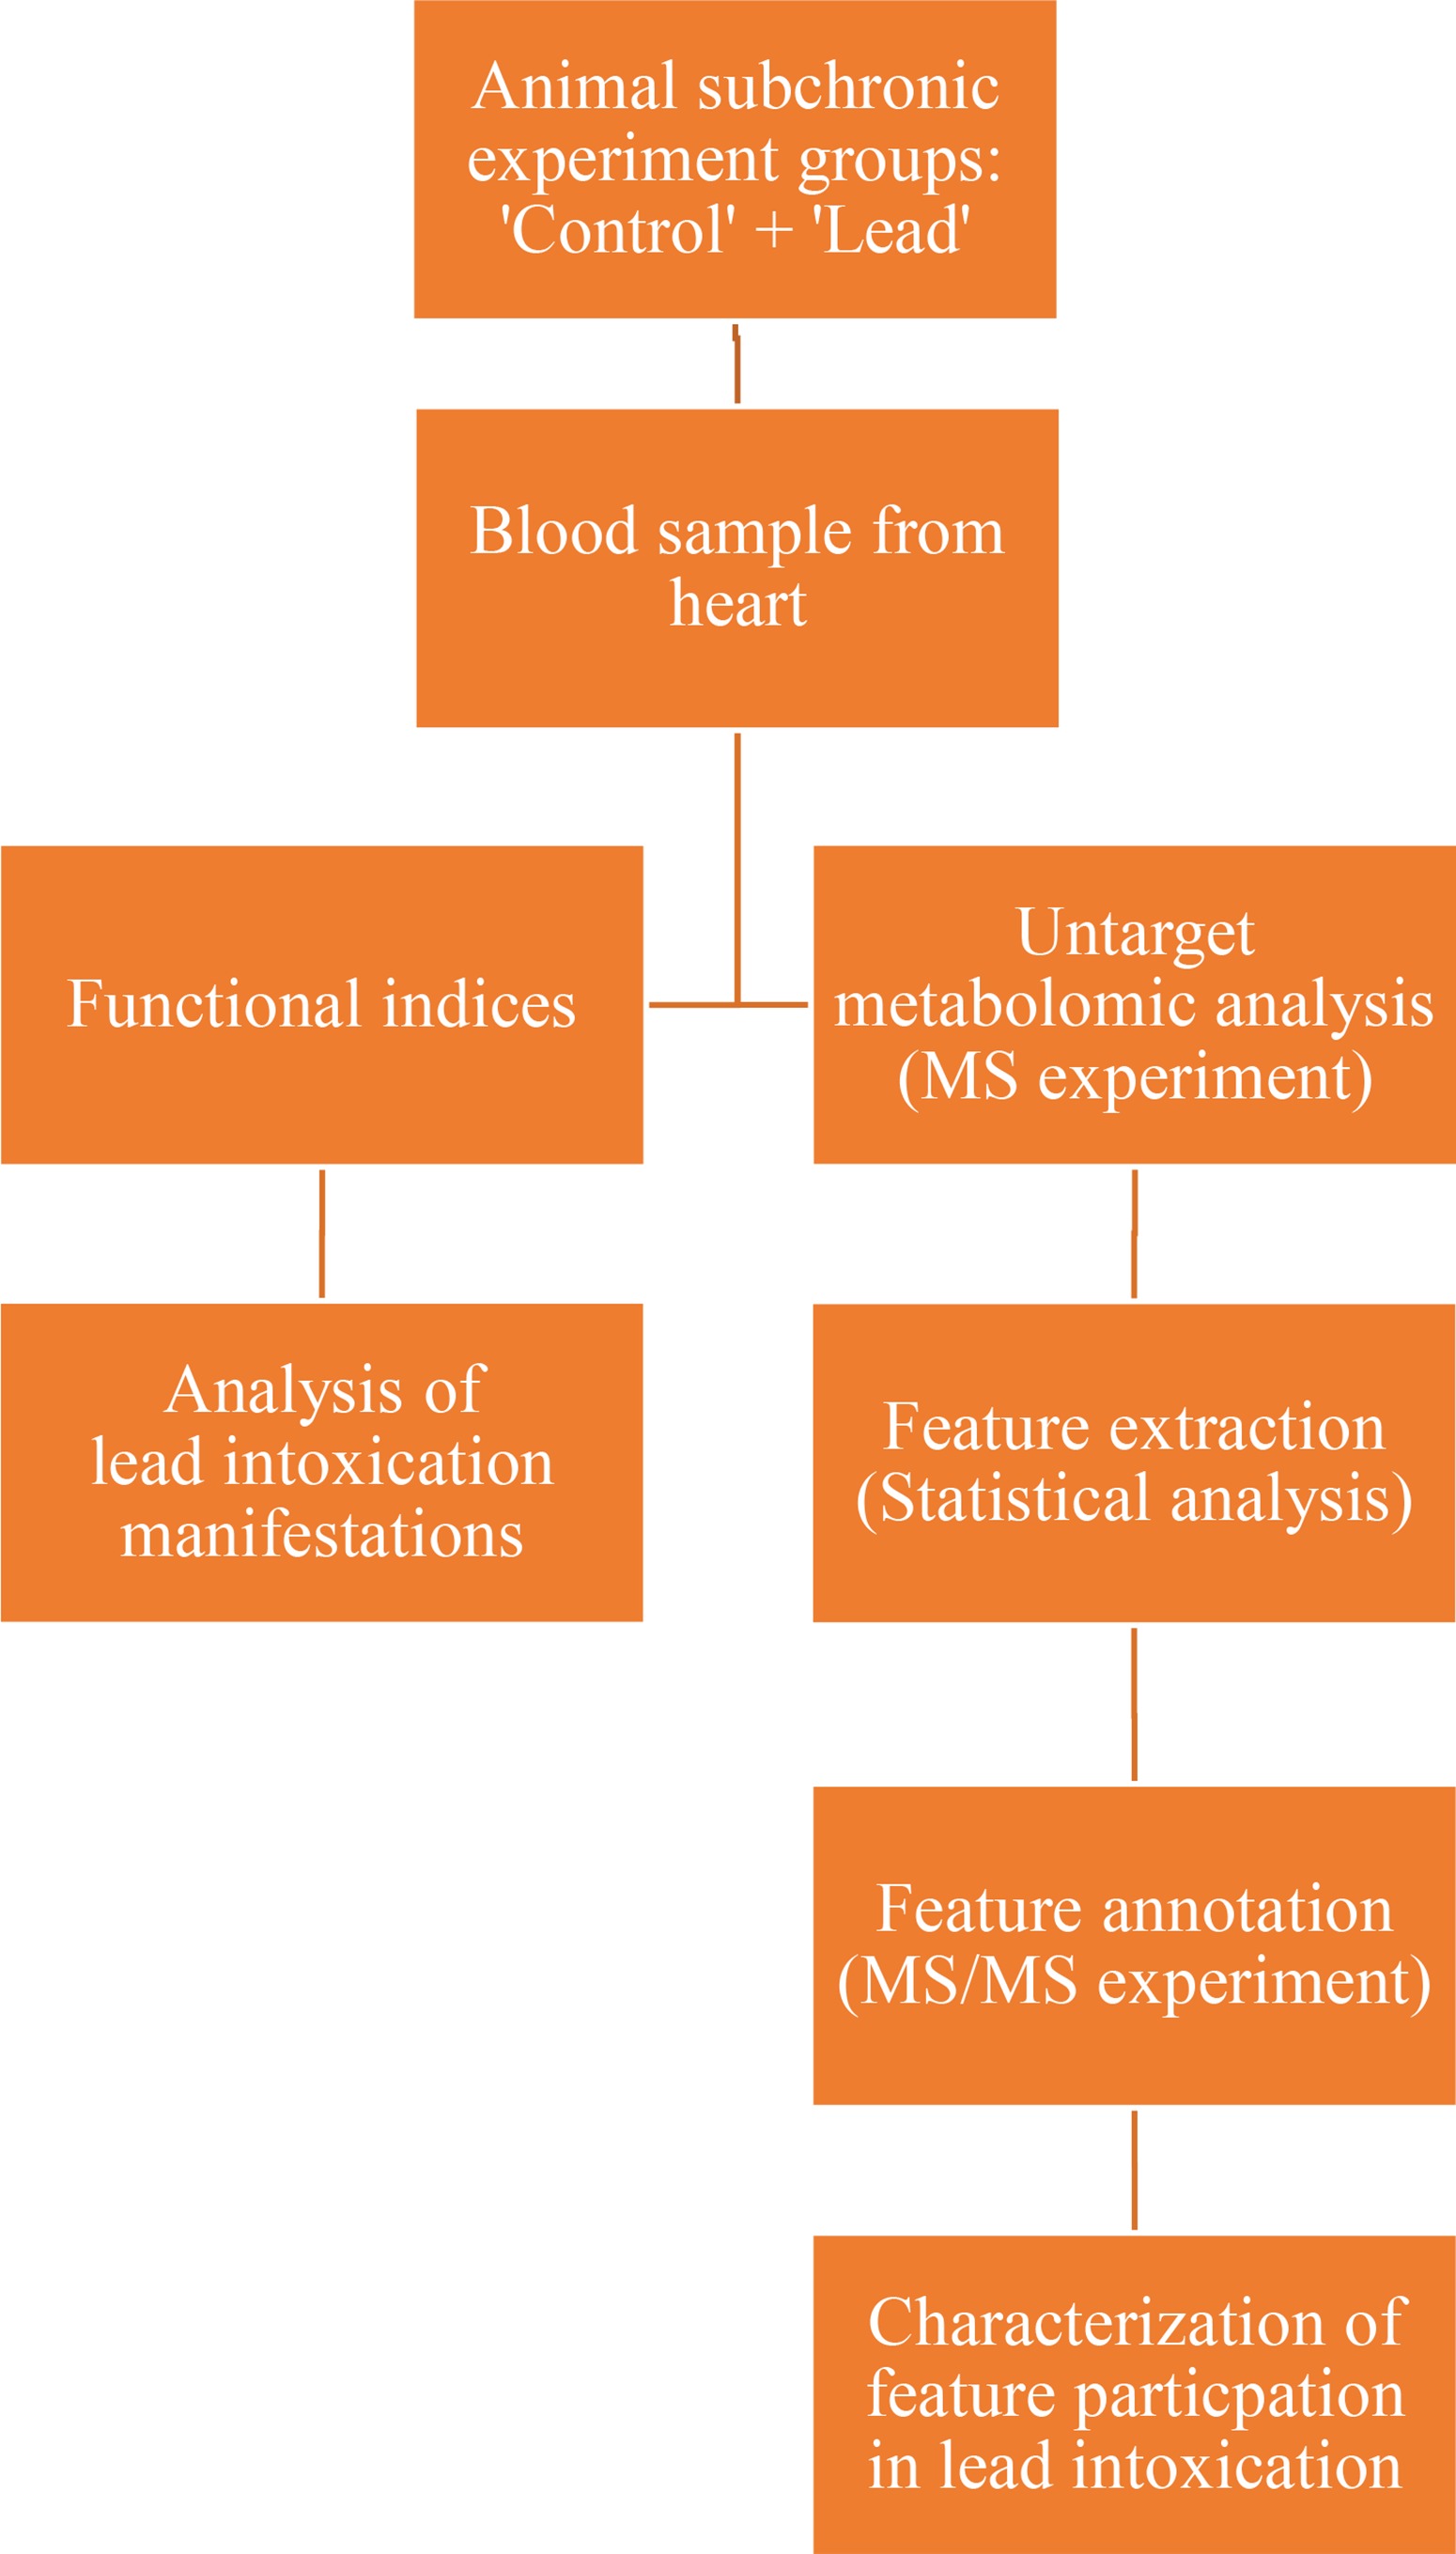
The study flowchart is given in Figure 1.
Reagents
The reagents used included: lead acetate, distilled water, saline, methanol HPLC grade, water HPLC grade, acetonitrile HPLC grade, and formic acid HPLC grade.
Animal experiment design
An experiment was conducted using own breeding colony white rats, aged 4–5 months and body weight from 210 to 290 g. Two groups – ‘Lead’ and ‘Control’ – were formed, both with 11 individuals. All animals received a standard feeding ration PK-120, whose composition and characteristics are given in Table 1.
Table 1
Characteristics of feeding ration PK-120
Three times per week both groups had intraperitoneal injections; the ‘Lead’ group received a lead acetate solution in distilled water with lead content in count to single dose 11 mg/kg body weight; the ‘Control’ group received 2 mL saline solution. Total lead dose received by one animal corresponded to LD50 for lead acetate – it was established empirically that such dosing manner is effective for intoxication signs manifestation14. The study was conducted according to the guidelines of the Declaration of Helsinki, and approved by the Local Ethics Committee of the Yekaterinburg Medical Research Center for Prophylaxis and Health Protection in Industrial Workers (Protocol No 8 dated 18.11.2018).
Blood sampling
Blood was taken in vacuum tubes after the lapse of 6 weeks, with a preliminary injection of heparin, and stored until analysis at -50oC.
Blood functional indices
Quantification of hemoglobin levels was conducted by the hematological analyzer ‘Methic 18’ used according to the diagnostic kits. Reticulocyte was counted using optical microscopy after brilliant cresyl blue staining. Other measured parameters were determined using appropriate methods and kits15.
Blood pressure measurements
Instrument complex ‘CODA-HT8’ with software from Kent scientific corporation was used for registration of heart rate, systolic and diastolic blood pressure.
HPLC-MS sample pretreatment
Four blood samples were randomly selected from both groups of animals. Sample preparation was conducted according to Cheng et al.16. In brief, 100 mcL of serum, separated at 4000 r/min for 10 min, was mixed with 400 mcL of ice-cold methanol for fibrine precipitation at 12000 r/min. Serum was held at 4oC during one hour and finally centrifugated at 14000 r/min. Supernatant was separated for analysis.
HPLC-MS analysis
HPLC-MS analysis was conducted using a tandem quadrupole time-of-flight mass spectrometer Agilent 6545 AdvanceBio Q-TOF, connected with HPLC Agilent 1290 Infinity II.
Liquid chromatography
Samples were preliminary separated using a Zorbax Eclipse Plus C18 RRHD 1.8 μm 2.1×50 mm column. Gradient elution was made as described at Cheng et al.16. Eluent composition was: phase A – 0.1% formic acid solution in water; and phase B – 0.1% formic acid solution in acetonitrile. Column temperature was 40°C, gradient parameters were: 0 min – B 8%, 2 min – B 20%, 8 min – B 45%, 20 min – B 85%, 24 min – B 95%, 26 min – B 8%, and 28 min – B 8%.
Mass-spectrometry data acquisition and processing
Sample analysis was conducted using the vendor’s software Agilent MassHunter Data Acquisition. Agilent Qualitative Workflows were used for Molecular Features extraction. Statistical analysis for data obtained were made with Mass Profiler Professional, including PCA-analysis and t-test with statistical significance set at p<0.05. Further tandem CID MS/MS experiment was performed for statistically selected features. Presented algorithm was used for structure annotation: ion adduct determination, generation of the empirical formulas list using isotopic distribution, and structure formula elucidation by looking for characteristic fragmentation patterns. Empirical formulas were generated in Agilent MassHunter Qualitative Analysis Navigator. Compound class and structure formula were defined by two steps: experimental fragment spectra interpretation and in silico spectra generation, using MS-FINDER and MetFrag software17-19.
RESULTS
Blood biochemical and hematological analysis
Results of the biochemical and hematological analysis are presented in Table 2.
Table 2
Results of biochemical and hematological analysis
| Parameter | Control Mean ± SD | Lead Mean ± SD |
|---|---|---|
| Hemoglobin, g/L | 148.60 ± 2.44 | 107.20 ± 3.38 * |
| Hematocrit, % | 16.73 ± 0.53 | 12.81 ± 0.21 * |
| Peripheral blood reticulocytes, ‰ | 21.75 ± 2.25 | 68.89 ± 4.90 * |
| Erythrocytes, 1012/mL | 7.17 ± 0.18 | 7.34 ± 0.17 |
| Average erythrocyte volume, μm3 | 46.91 ± 0.84 | 35.24 ± 0.72 * |
| Average hemoglobin content in 1 erythrocyte, 10-12 g | 20.78 ± 0.29 | 14.69 ± 0.29 * |
| Average hemoglobin concentration in erythrocyte, g/L | 436.20 ± 6.80 | 419.00 ± 12.95 |
| Erythrocyte distribution width, % | 14.76 ± 0.21 | 27.43 ± 0.32 * |
| Platelets, 106/mL | 787.09 ± 33.06 | 1454.18 ± 80.25 * |
| Platelets average volume, μm3 | 5.510 ± 0.091 | 9.44 ± 0.40 * |
| Thrombocrit, % | 0.2210 ± 0.0082 | 0.692 ± 0.056 * |
| Width of platelets distribution, % | 12.66 ± 0.40 | 24.26 ± 1.07 * |
| Leukocytes, 106/mL | 11.71 ± 1.12 | 21.53 ± 1.90 * |
| Basophiles, 106/mL | 0.00 ± 0.00 | 0.00 ± 0.00 |
| Basophiles, % | 0.00 ± 0.00 | 0.00 ± 0.00 |
| Eosinophilia, 106/mL | 0.38 ± 0.11 | 0.333 ± 0.063 |
| Eosinophilia, % | 3.00 ± 0.65 | 2.00 ± 0.42 |
| Neutrophils stickyeric, 106/mL | 0.38 ± 0.11 | 0.400 ± 0.087 |
| Neutrophils stickyeric, % | 0.38 ± 0.11 | 0.50 ± 0.13 |
| Segmented neutrophils, 106/mL | 1.57 ± 0.16 | 4.06 ± 0.51 * |
| Segmented neutrophils, % | 13.91 ± 1.27 | 18.80 ± 1.25 * |
| Monocytes, 106/mL | 0.656 ± 0.088 | 1.32 ± 0.19 * |
| Monocytes, % | 5.55 ± 0.39 | 5.70 ± 0.52 |
| Lymphocytes, 106/mL | 8.99 ± 0.88 | 14.55 ± 1.28 * |
| Lymphocytes, % | 76.55 ± 1.23 | 72.29 ± 0.57 * |
| Succinate dehydrogenase, the number of formazan pellets in 50 lymphocytes | 450.20 ± 3.50 | 417.09 ± 6.40 * |
| Overall serum protein, g/L | 69.39 ± 1.39 | 62.24 ± 1.54 * |
| Albumin, g/L | 44.33 ± 1.43 | 34.92 ± 0.69 * |
| Globulins, g/L | 26.58 ± 1.28 | 26.65 ± 0.96 |
| A/G index | 1.698 ± 0.092 | 1.347 ± 0.046 * |
| Alanine transaminase, E/L | 53.54 ± 2.74 | 34.22 ± 1.03 * |
| Aspartate transaminase, E/L | 170.64 ± 10.62 | 182.90 ± 12.96 |
| AST/ALT ratio | 3.41 ± 0.27 | 5.06 ± 0.30 * |
| Glucose, mmol/L | 5.69 ± 0.17 | 4.47 ± 0.22 * |
| Lactate, mmol/L | 7.55 ± 0.51 | 5.60 ± 0.84 ** |
| SH-groups, mmol/l | 5.53 ± 1.89 | 4.92 ± 1.35 |
| Gamma-glutamyltransferase, eq/L | 0.50 ± 0.18 | 1.60 ± 0.28 * |
| Alkaline phosphatase, E/L | 148.21 ± 22.76 | 125.21 ± 16.30 |
| Lactate dehydrogenase, E/L | 2450.00 ± 146.86 | 2387.27 ± 210.77 |
| Amylase, E/L | 3975.13 ± 298.38 | 2174.70 ± 138.86 * |
| Catalase, mcmol/L | 0.381 ± 0.086 | 0.381 ± 0.086 |
| Glutathione, mcmol/L | 14.40 ± 2.07 | 12.21 ± 1.51 |
| Ceruloplasmin, mg/% | 91.14 ± 3.37 | 113.05 ± 3.44 * |
| Malondialdehyde, mcmol/L | 5.78 ± 0.22 | 6.47 ± 0.62 |
| Serum uric acid, mcmol/L | 83.88 ± 3.05 | 123.78 ± 5.93 * |
| Bilirubin, mcmol/L | 1.400 ± 0.088 | 1.28 ± 0.14 |
| Cholesterol, mmol/L | 1.68 ± 0.12 | 1.54 ± 0.11 |
| High-density lipoprotein, mmol/L | 0.987 ± 0.074 | 0.745 ± 0.061 * |
| Low-density lipoprotein, mmol/L | 0.261 ± 0.035 | 0.315 ± 0.032 |
| Triglycerides, mmol/L | 1.41 ± 0.20 | 1.50 ± 0.15 |
| Calcium in serum, mmol/L | 2.487 ± 0.042 | 2.353 ± 0.029 * |
| C-reactive protein, mg/L | 0.00 ± 0.00 | 0.01 ± 0.01 |
| Creatine kinase, E/L | 1217.67 ± 313.73 | 953.90 ± 206.74 |
| Creatine kinase MB, E/L | 1337.13 ± 123.30 | 1358.82 ± 105.66 |
| Osteocalcin, ng/mL | 599.12 ± 39.92 | 816.89 ± 35.96 * |
| Thyroid-stimulating hormone, pg/mL | 11502.31 ± 396.57 | 12607.65 ± 349.86** |
| Vascular endothelial growth factor, IU/mL | 5.67 ± 0.40 | 5.13 ± 0.31 |
| Cortisol, nmol/L | 73.77 ± 8.30 | 66.72 ± 10.49 |
| Angiotensin-converting enzyme, E/L | 143.00 ± 14.74 | 236.36 ± 21.95 * |
| δ-Aminolevulinic acid in blood, mcg/mL | 0.85 ± 0.31 | 20.59 ± 4.77 * |
Blood pressure
For the ‘Control’ group the pressure was: systolic 140.79 ± 7.41, diastolic 96.34 ± 5.80 Torr. For the group ‘Lead’: systolic 134.53 ± 7.01, diastolic 93.42 ± 6.90 Torr.
Metabolomic analysis
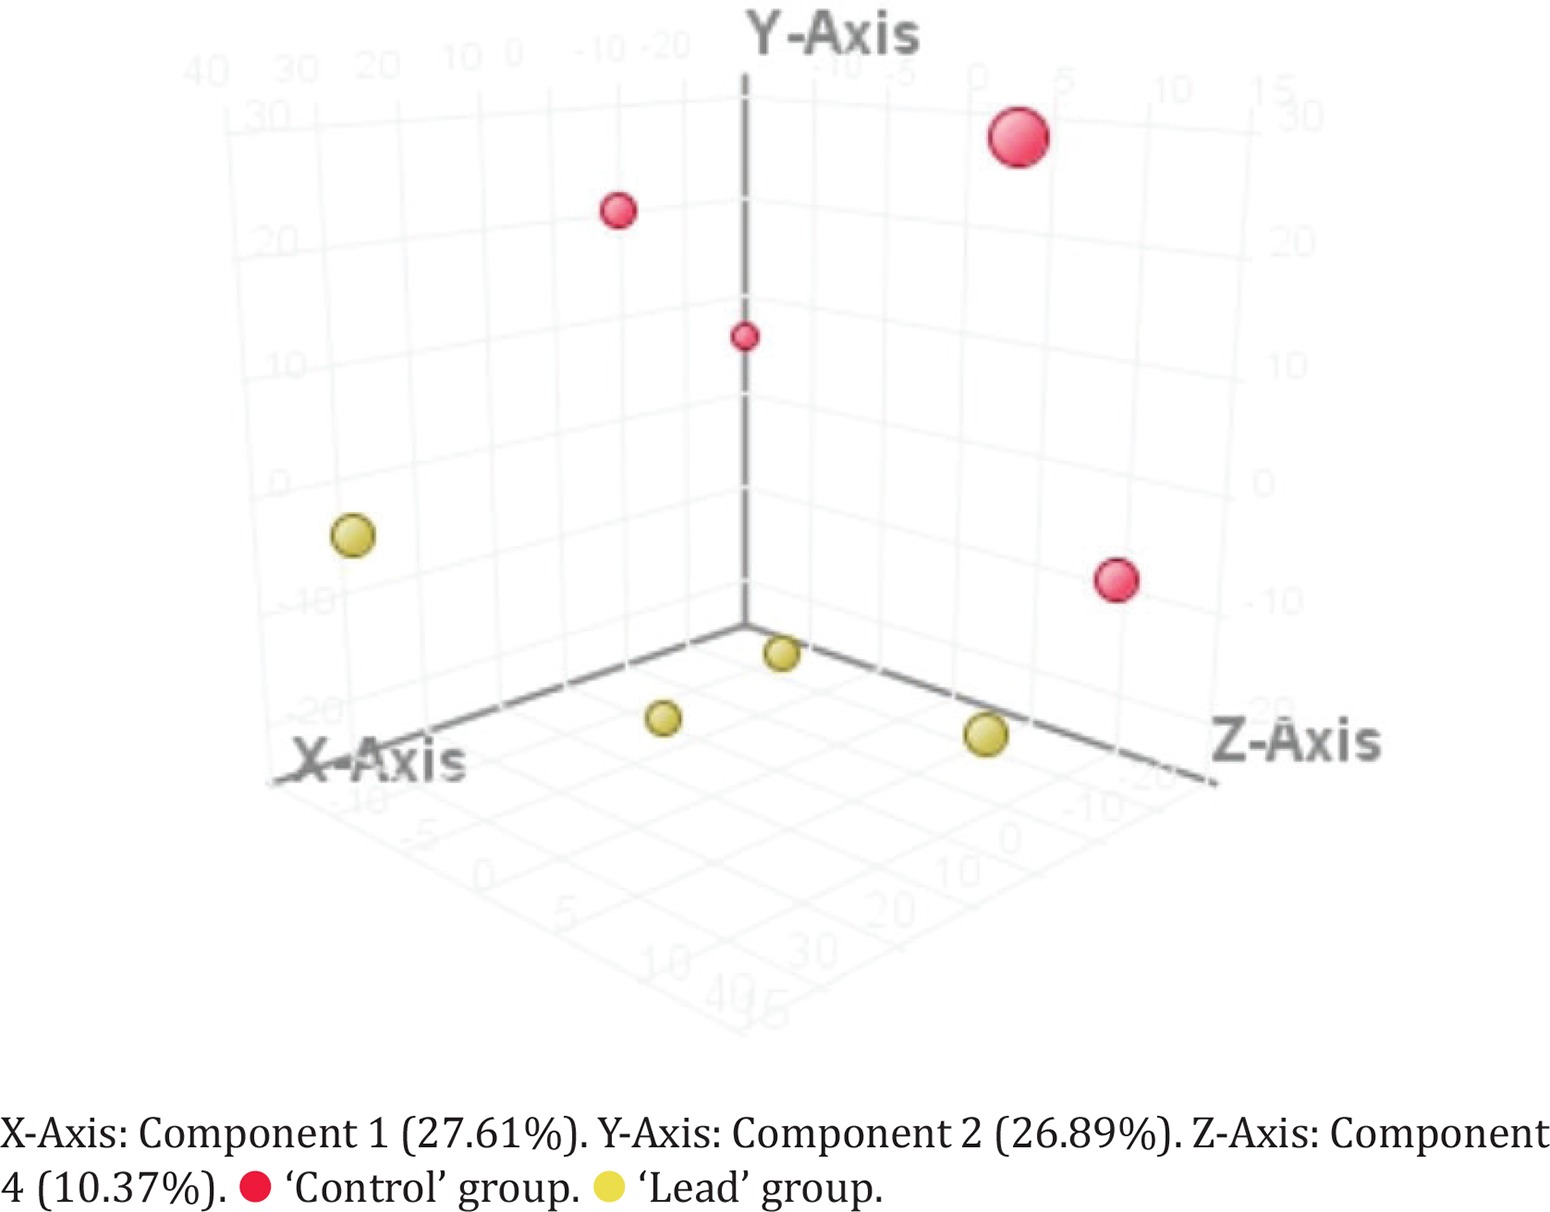
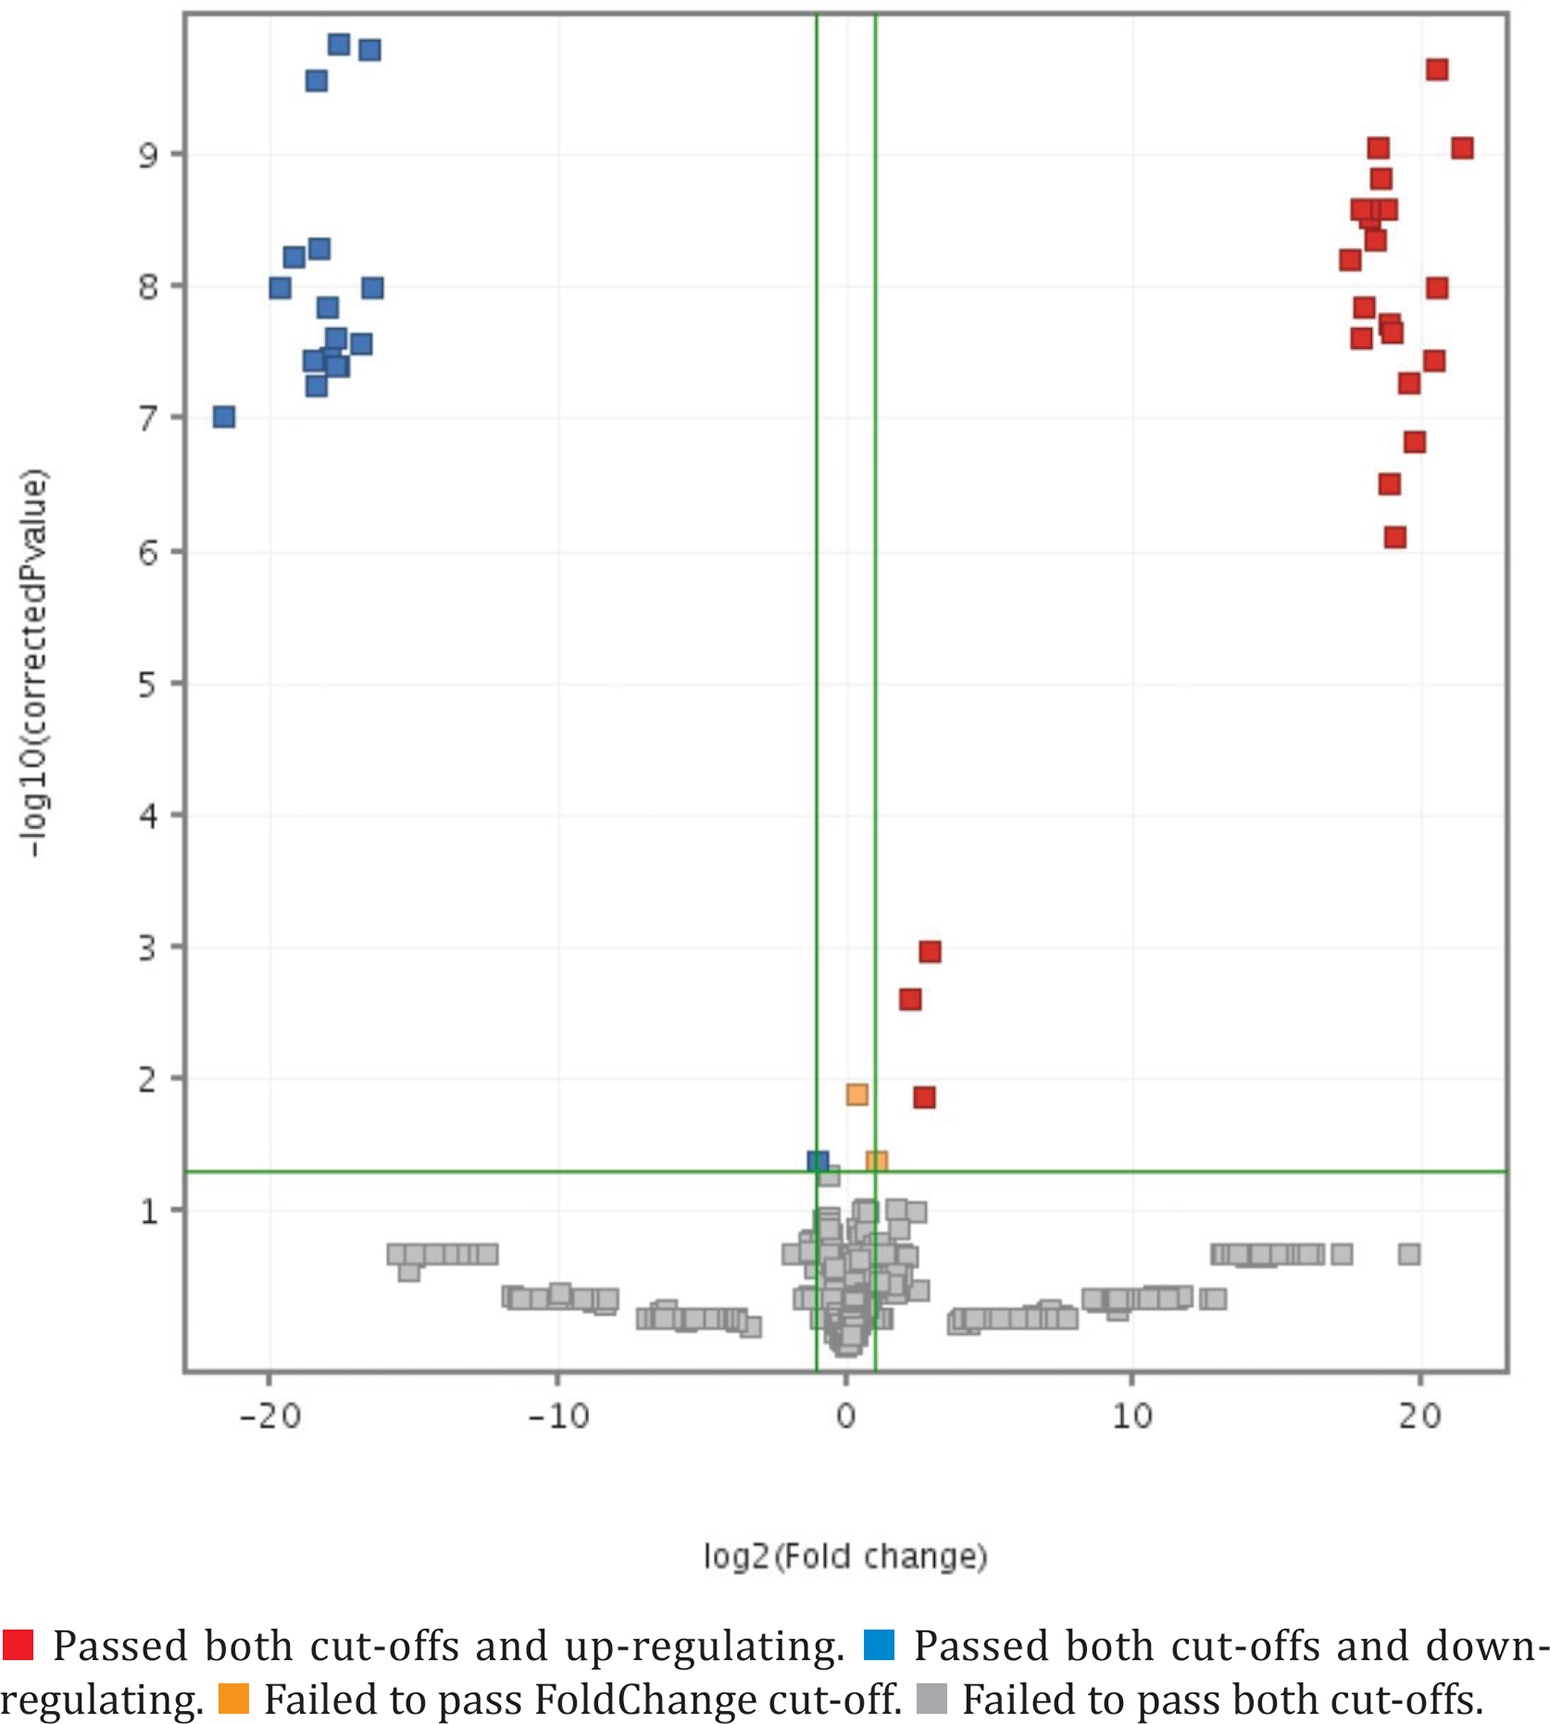
Using PCA-analysis followed by t-test were extracted 38 features, presented in Table 3 (annotated features are ‘+’-marked), PCA 3D-plot is presented in Figure 1, t-test and FolgChange filtering results are presented as a Volcano-plot in Figure 2. It was possible to annotate structures for eight metabolites given in Table 4.
Table 3
List of extracted features
Table 4
List of annotated metabolites
DISCUSSION
Blood lead levels
Blood concentrations of lead were not measured in this study, but there are results of a previous experiment with the same conditions and lead dosing for lead-exposed ‘Group 4’ and ‘Control’ groups: 12036.36 ± 1670.55 mcg/L and 6.73 ± 1.97 mcg/L, correspondingly14.
Blood functional indices – lead intoxication
Results of hematological analysis showed a decrease in hemoglobin content and hematocrit, with an increase in reticulocytes number; also, an increased level of δ–aminolevulinic acid, coupled with the above-mentioned facts points to well-known lead-associated anemia. Inflammation, also a characteristic of lead intoxication, was confirmed by increased leukocytes and lymphocytes levels20. Elevated number of platelets and the thrombocrit observed correspond to lead poisoning21. Other signs of lead intoxication were observed: a decrease in total serum protein content; and particularly, albumins associated with liver disturbances22. Changes in such significant liver parameters as ALT and AST vary according to the exposure route and dose22,23 – in our case ALT increased while AST remained unchanged. Lead-associated kidney disturbance is also well-known24,12 – in our case it was manifested as an elevated level uric acid in serum.
Metabolomic study
The aim of this study – using an untargeted metabolomic approach, was to define substances presenting in the blood, which have a changed concentration under lead toxic exposure. Statistical analysis of obtaining raw data allowed us to extract 37 features, 8 of which were annotated. The term ‘annotated’ is used in the context of the Metabolomic Standards Initiative set by the Chemical Analysis Working Group, and means ‘Putatively annotated with m/z and MS/MS matching’ – 2nd level of confidence25. This fact may be considered as a drawback of this study, which could be fixed by measuring standards in the future. Nevertheless, in this case, we tried to make the most detailed analysis of fragmentation spectra for each substance, to compensate for this disadvantage. Twenty-nine m/z values were excluded from further consideration, so there was no possibility to establish fragmentation patterns, due to poor fragmentation spectra.
Analysis of mass spectra 10,13-epoxy-10,12-octadecadienic acid (EpODE) showed the presence of alkyl-series with general formula CnH2n+1, with chain length 5, corresponding to unsubstituted pentyl radical (Supplementary file Figure 4). Intensive peak of [M-H2O+H]+ points to easy water elimination in case of carboxylic acid to acyl-cation formation with empirical formula C18H29O2. There is no more water loss from this cation, so a second oxygen atom belongs to a keto- or an ether-group. Next, cation 227.2128 produce a series of fragments 55.0198 – 141.1281, corresponding to the presence of unsubstituted 8-member alkyl chain in a molecule. The rest of the molecule has formula C4H2O, which fits to double-substituted furan moiety. For EpODE, a derivative of conjugated 9,11-linoleic acid (CLA), there is no mention in previous studies in the context of lead intoxication and oxidative stress. CLA acid naturally occurs in rumens, as a conversion result of α-linoleic acid by microbial enzymes26,27. Accordingly, CLA gets into the rat lipid pool from dietary source and may be included to membrane phospholipids to sn-1 and sn-2 positions of glycerol28,29. EpODE – is a structural analog of the so-named furanic fatty acid (FFA) from plants and seafood, but with significant difference – the lack of a methyl group at β-carbon atom at the furan ring (Supplementary file Figure 5).
The substances discussed have antioxidative activity, but EpODE, as a unsubstituted furan derivative, possesses it at less extent30,31. For the formation of EpODE from CLA and its elevated expression, we proposed the following hypothesis. Initially, CLA is ingested with the food source to the rat organism and incorporated into the phospholipids of blood cell membranes or remains in the blood flow. Next step – oxidation – may occur spontaneously in the presence of singlet oxygen, the reactive form of oxygen32. This fact associated with oxidative stress, a characteristic of lead intoxication, was manifested in our study by slightly increased MDA levels. As erythrocytes bind the dominant part of lead in the blood33,34, it could be proposed that erythrocytes cell membrane is the source of EpODE. Considering that furanic fatty acid enters mammals with plant food and seafood, where it is observed first35-38, this substance has significant antioxidative activity39,40. The function of this substance in mammals is thus protection from oxidative stress41. Thus, elevated concentration of this substance in the group ‘Lead’ is a manifestation of lead-induced oxidative stress proceeding42-44.
In the mass spectra of all annotated long-chain acylcarnitines (3-oxooctadecanoylcarnitine (3-OODC), hydroxyl inol eoi l ecarnit ine (HLC) , 5/6-hydroxyhexadecanoylcarnitine (5/6-HHDC), 3-oxohexadecanoylcarnitine (3-OHDC)) were observed neutral losses from bond cleavages in position 1 (59.0735 – C3H9N), 1+3 (102.0230 – C4H6O3), and 3 (161.1009 – C7H15NO3). Also, there are characteristic fragments from these cleavages: 1 (60.0807 – C3H10N), 1+2 (85.0287 – C4H5O2), and 2 (144.1038 – C7H14NO2) (Supplementary file Figure 6)45. Empirical formulae of 3-OODC and 3-OHDC show that these substances are homologues. The position of the keto-group was estimated by the presence of neutral loss C2H2O (cleavage 4) from ketoacylium ion (281.2522 for 3-OODC and 253.2154 for 3-OHDC), with formation of acylium-cation shorter on two carbon atoms than the parent ion (239.2395 and 211.2060, respectfully). Taking it to account, it could be proposed that the keto-group belongs to third carbon atom. Acyl-cation with eliminated water from fragmentation of HLC was C18H28O – it shows the presence of 4 double bonds: one belongs to the keto-group, the second corresponds to water cleavage, and other two to the initial alkyl radical. Naturally formed fatty acid with two double bonds is a linoleic acid, so the positions of these double bonds could be at 9 and 12 carbon atoms. It was not possible to estimate from mass spectra a position of the third double bond, corresponding to the position of the hydroxy group. Mass spectra of 5/6-HHDC have alkyl series from C11H19O to С6H9O with RDB index 2.5, ending with C3H5O with RDB 1.5. Cleavage of this fragment probably is from the vinyl-position: this fact assumes the formation of a double bond from water elimination between 5 and 6 carbon atoms. Correspondingly, a hydroxy group belongs to one of these atoms. Acylcarnitines are known biomarkers of mitochondria dysfunction and oxidative stress46,47; they are also described as inflammation inductors48. Previous metabolomic studies of lead toxicity are not numerous and mention changes in amino acids, lipid metabolism, and in the concentrations of short- and long-chain acylcarnitines, diacylglycerols, and sphingomielins9,13,49. The results of our study agree with these previous studies, as we also observed an increase in the blood concentration of acylcarnitines. The following mechanism of occurrence of this phenomenon is proposed. Reduced oxygen supply (decreased haemoglobin level in ‘Lead’ group) leads to disturbances in the cell’s processes which use oxygen. In cooperation with lead-induced oxidative stress, and breathe-chain violations, this fact potentially leads to lower efficiency of the β-oxidation cycle. This may be a reason for increased long-chain acylcarnitine concentration, as a consequence of accumulation of oxy- and oxo-acylCoA intermediate products in mitochondria with further elimination in acylcarnitine form out of the mitochondria and cell membrane50-52. As blood was extracted from the heart, we assume the origin of elevated acylcarnitines is a myocardium, also due to known lead cardiotoxicity53,54. Thereby, it could be concluded, that an elevated concentration of acylcarnitines in the exposed to lead group is a manifestation of disturbances in a β-oxidation cycle and oxidative stress.
Mass spectra of 4-decenoylcarnitine have characteristic losses and fragments of acylcarnitines, mentioned above (positions 1, 2 and their combinations). Retro-ene rearrangement of acyl-cation C10H17O (153.1282) leads to the formation of fragment 97.0644 (C6H9O, cleavages at 3 and 4 positions) – this fact corresponds to the double bond position between the fourth and fifth carbon atoms (Supplementary file Figure 7). Middle-chain fatty acids are able to enter mitochondria with and without passing the carnitine transport system55. Due to β-oxidation cycle disturbances, discussed above, there is a deficit of carnitine in mitochondria, so a non-carnitine way for middle chain acid was more preferable – a lack of free carnitine was also observed in the other lead intoxication study49. This fact explains the reduced concentration of 4-decenoylcarnitine in lead-exposed group in comparison to the control group.
Characteristic losses and fragments of lysophosphatidylserines are observed in mass spectra of Lyso-1-docosahexaenoyl-glycero-3-phosphoserine (LysoPS(22:6)) (1 - 87.0309, 1+2 - 97.9763, 2+3 - 74.0380)56 (Supplementary file Figure 8). The hydrocarbon radical of acylium-cation has six double bonds – these positions were estimated by RDB indices of alkyl and acyl fragmentation series. It is known that lead exposure increases apoptotic processes in mammals57. Enrichment of outer cell membrane surface with serine-containing phospholipids is one of the apoptosis stages58. These substances are used by macrophages for localizing and absorbing apoptotic cells. The following mechanism of the phenomenon is proposed. Specific phosphatidylserine-phospholipase A2 produced by platelets, hydrolyze phospholipids of apoptotic cells, with elimination of LysoPS. This substance, in turn, provides apoptotic cell engulfment by macrophages59. Thus, increasing of LysoPS(22:6) concentration in exposed to lead group may serve as a marker of intensification of the apoptotic processes – this fact is also confirmed by the results of previous metabolomic investigations60-62.
Fragmentation of 15-Hydroxy-5,8,11,13-eicosatetraenoic acid (15-HETE) begins with the elimination of two water molecules: one from carboxylic group, another from hydrocarbon radical (Supplementary file Figure 9). Leftover acyl-cation further dissociates to fragments C5H11 (71.0868) and C3H3O (55.0178) – this fact points to the five double bonds located between C5 and C15. The set of fragments from C6H9O (97.0656) to C10H13O (149.0965) points to double bond positions at C5, C8, and C1163. The last double bond is located at the conjugating position at C13, and hydroxy-group at C15 – a consequence of initial oxygen attachment to the double bond at C14. Increased expression of 15-HETE was observed on exposure to ambient nanoparticles, containing, in general, polyconjugated aromatical hydrocarbons and heavy metals (including lead)64, and at neuroinflammation process65. Hypoxia and oxidative stress are reasons of apoptotic processes, discussed above. It is known, that oxygen deficit leads to activation of macrophage’s 15-lipoxygenase ferment66. This ferment catalyzes formation of 15-HETE from arachidonic acid, presenting in a cell membrane pool of macrophages67. This substance possesses anti-inflammatory function, due to inhibiting 5- and 12-lipoxyhenaze ferments, accordingly reduce the concentration of proinflammatory eicosanoids68,69. Hematological analysis for the ‘Lead’ group shows an increased number of leukocytes, which corresponds to inflammation, so expression of 15-HETE may be a manifestation of a compensatory mechanism, aimed to decrease inflammation. As for apoptotic process intensification, it is known, that 15-HETE possesses the antiapoptotic effect, which acts as an inhibitor of apoptogenic peptides. Elevated concentration of 15-HETE may also serve as a sign of passing antiapoptotic regulatory mechanism.
CONCLUSIONS
Changes in concentration of hydroxy- and oxo-acylcarnitine, in the context of β-oxidation process, may serve as a marker of disturbances in this process for the lead-exposed group, due to lead-induced oxidative stress and hypoxia. Furanic and 15-hydroxy-derivatives of polyunsaturated fatty acids, relevant to oxidative stress, may take part in antiapoptotic and antioxidative mechanisms, and also serve as biomarkers of these processes. Lysodocosahexaenoylphosphoserine (22:6), observed in larger quantity in the lead-exposed group, means intensification of apoptotic processes under lead exposure, which is consistent with existing literature, so this substance may serve as a biomarker in this context.