

INTRODUCTION
In the United States (US), an estimated 500 million lbs (228 million kg) of herbicides are used annually1. Herbicides applied to crops and soil can reach surface water and groundwater due to rainfall, irrigation, or soil erosion transport processes, potentially leading to contamination2-4. Terrestrial contamination can occur through atmospheric deposition, and when herbicide residues on plants enter the food chain2,5,6.
Glyphosate, N-(phosophonomethyl)glycine, belongs to the phosphono amino acid class of pesticides2,7,8. Since its registration in the US in 1974, glyphosate has become one
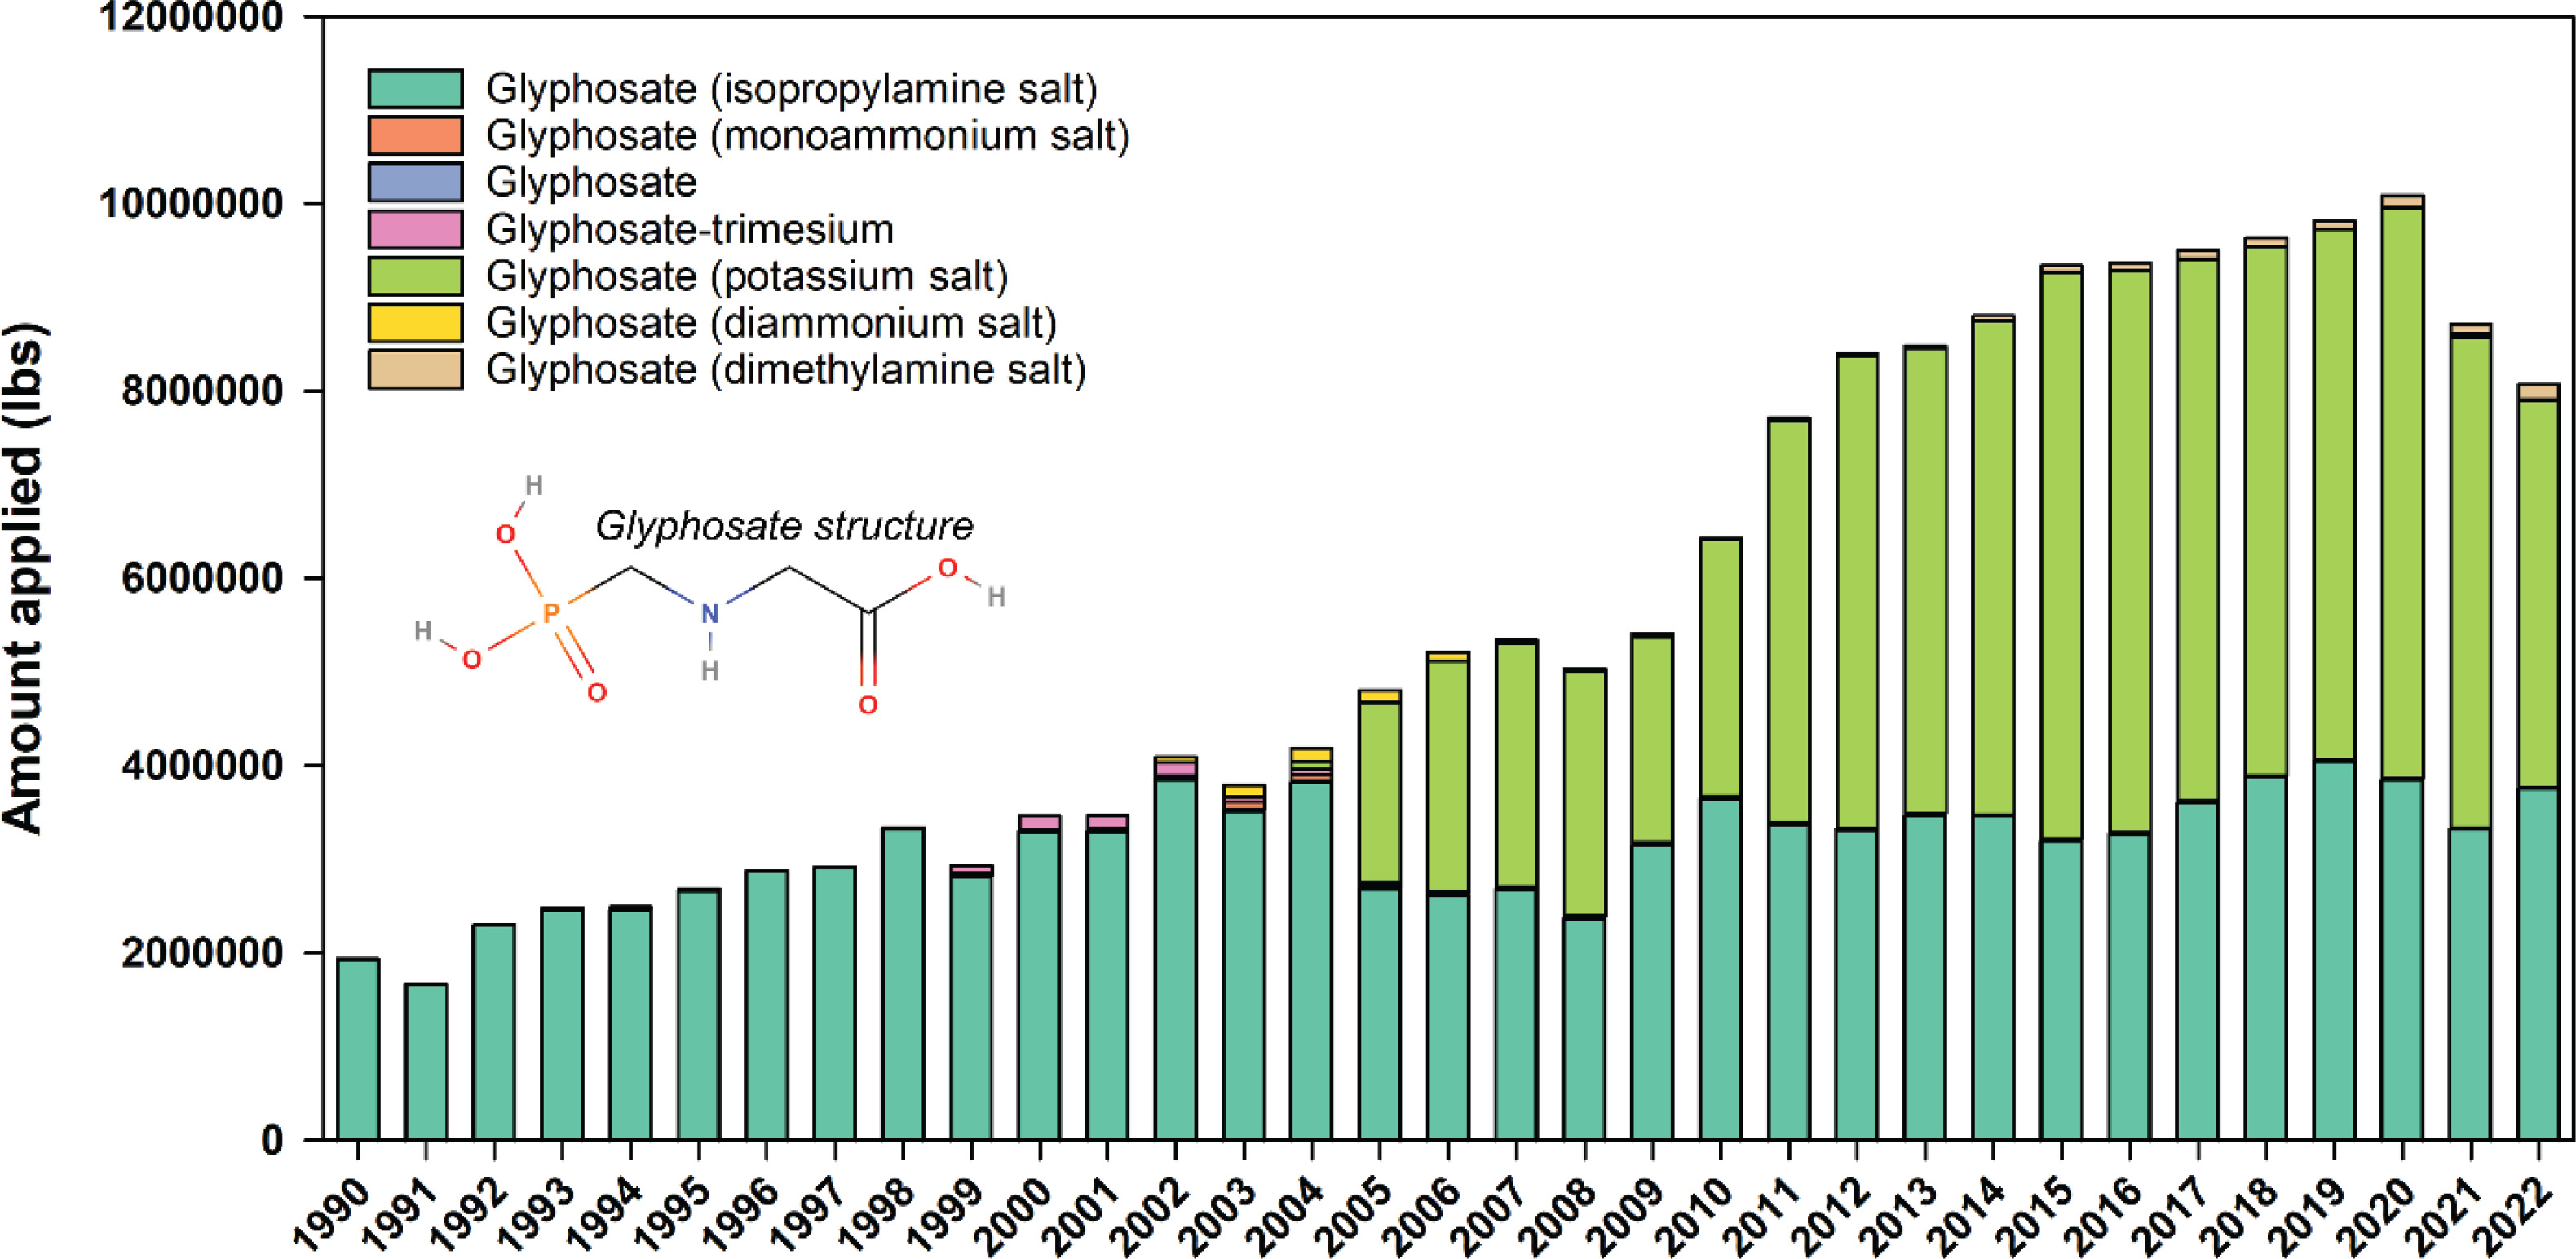
of the most widely used herbicides in agricultural (e.g. crops, flowers production) and non-agricultural (e.g. parks, golf courses, greenbelts) settings. Glyphosate is typically used in herbicides formulated as water-soluble salts (e.g. glyphosate potassium) to increase solubility and absorption rate8. In California, the annual amount of glyphosate and its various salts applied across all use types increased from about 2 million lbs in 1990 to about 10 million lbs in 2020, then decreased to about 8 million lbs in 2022 (Figure 1). The most common glyphosate salts used were glyphosate isopropylamine and potassium salts9.
Figure 1
Annual usage of glyphosate compounds in California from 1990 to 2022 per California Department of Pesticide Regulation (CDPR). Glyphosate chemical structure is noted in the figure (generated in MolView.org)
Glyphosate residues may be present in a variety of commodities. To ensure that the dietary intakes of food items containing glyphosate pose no significant risks, the European Union (EU) Commission established maximum residue levels (MRLs) for glyphosate that range from 0.05 to 50 ppm10. Similarly, the United States Environmental Protection Agency (EPA) established tolerance levels for glyphosate residues in a variety of commodities, ranging from 0.05 to 400 ppm11.
According to the European Chemicals Agency (ECHA), glyphosate has H318 and H411 hazard labels, reflecting its corrosive and environmental hazards, respectively12. Although glyphosate was designed to control undesirable vegetation, negative impacts to non-target species (e.g. honeybees) were also reported in laboratory and field studies13-15. In 2015, EPA published the Preliminary Ecological Risk Assessment in Support of the Registration Review of Glyphosate and Its Salts16, in which it assessed risk to ecological receptors. For honeybees, EPA concluded that although acute adult contact and oral semi-field honeybee toxicity data suggested that glyphosate exposure was low, the calculated environmental concentrations were greater than the highest concentrations tested in honeybees. Due to the lack of toxicity data at higher test concentrations, it was unclear if exposure to glyphosate residues on foliage at application rates of ≥1.92 lbs acid equivalent (a.e.) per acre and >5.7 lbs a.e./acre could result in adverse effects in larval and adult honeybees, respectively. In birds (also used as surrogates for terrestrial-phase amphibians), exposure to glyphosate residues on foliage showed the potential to impact growth but not reproductive parameters. In mammals, exposure to glyphosate residues on foliage showed the potential to impact growth and reproduction16.
In 2020, EPA completed an Interim Registration Review Decision for glyphosate and noted that: 1) no potential risks were identified for fish, aquatic invertebrates, or aquaticphase amphibians; 2) low or limited potential risks of concerns were identified for mammals and birds; 3) potential risks to non-target terrestrial and aquatic plants were primarily from spray drift and were heavily dependent on the application rate; 4) the likelihood of acute adverse effects to adult bees was considered low at application rates up to 5.7 lbs a.e./acre; however, it was uncertain if effects would occur at higher application rates. EPA indicated that additional data might be necessary to fully evaluate risks to bees17.
The current study demonstrates the application of EPA models for risk assessment in honeybees, herpetofauna, birds, and mammals. Although the study focuses on the active ingredient glyphosate, the methodology can be applied to proprietary ingredients in pesticide formulations. The available tools can be used by toxicologists, pesticide manufacturers, and stakeholders to inform decision-making in risk management, product development, and strategies to minimize adverse effects in non-targeted species. This study also extends the risk assessment conducted by EPA by including specific glyphosate usage data and more recent toxicity data.
METHODS
Overview
This study assessed the potential risks to honeybees, herpetofauna (i.e. reptiles and amphibians), birds, and mammals from exposure to glyphosate via foliar spray (typical application mode for glyphosate) using the 2022 glyphosate usage data from the California Department of Pesticide Regulations (CDPR), toxicity thresholds from the Ecotoxicology Knowledgebase (i.e. ECOTOX) and/or EPA16, as well as publicly available EPA models. To characterize risk, risk quotients (RQs) were generated and compared to levels of concern (LOCs).
Usage data
CDPR tracks the annual pesticide usage in the State of California in a comprehensive pesticide use database18. For this study, the 2022 Annual Statewide Pesticide Use Report Indexed by Chemical was relied upon for information on the chemical used, commodity or site, pounds applied, area treated, units treated, and the number of applications in California in 20229. The report was filtered to include entries that involved glyphosate formulations and provided the necessary information to calculate the application rate in units of mass per area. The amount of glyphosate applied was converted into units of lbs a.e./acre to account for the glyphosate component of the glyphosate salts, according to:
where, AGly is the glyphosate amount, AGly(S) is the glyphosate salt amount, and R is the molecular weight ratio of glyphosate to glyphosate salt, to be compatible with the EPA models. CDPR9 also included units of square feet (S), cubic feet (C), thousand cubic feet (K), or ‘miscellaneous unit’ (U). The area units were converted to acres (miscellaneous units were excluded).
Risk assessment
Toxicity thresholds
The ECOTOX database was used to identify toxicity thresholds of glyphosate in honeybees (Apis mellifera), herpetofauna, birds, and mammals. Study entries that used glyphosate as the ‘active ingredient’ were prioritized. Only studies where the observation duration was presented in quantifiable time (i.e. days) were included. Consistent with the associated models, both oral and dermal routes were considered for honeybees, whereas only oral routes (i.e. food, diet, and gavage) were considered for herpetofauna, birds, and mammals. The identified toxicity thresholds [i.e. median lethal dose (LD50), median lethal concentration (LC50), no-observed-adverse-effect level (NOAEL), and no-observed-adverse-effect concentration (NOAEC)] were input into the models. Toxicity thresholds noted in EPA16 were also considered.
Risk characterization
A risk assessment was conducted to evaluate the potential risks to honeybees, herpetofauna, birds, and mammals from glyphosate usage in agricultural settings. Briefly, the application rates from CDPR9 and toxicity thresholds from ECOTOX and/or EPA16 were input into the models BeeREX, T-HERPS, and T-REX to calculate the acute and chronic RQs in honeybees, herpetofauna, and birds and mammals, respectively. These models estimate the pesticide residue on the food items that these organisms ingest and derive the exposure doses, which are then compared to toxicity thresholds to calculate RQs. The RQs can then be compared to species-specific LOCs established by EPA to characterize risks. For detailed information on these models see EPA19. In addition to RQ determinations, the maximum glyphosate application rates at which none of the acute and chronic RQs would exceed the LOCs were calculated (Supplementary file).
Sensitivity analysis
A single, annual pesticide application was assumed when assessing risks; however, pesticides can be applied multiple times per year. To evaluate the effect of multiple applications, and as a proof-of-concept, an analysis was performed in herpetofauna using the median application rate, one of the acute and chronic toxicity thresholds, and several application frequency scenarios (Table 1).
Table 1
Annual application frequency scenarios used in the sensitivity analysis conducted in herpetofauna and depicted in Figure 7
| Number of applications | Application interval (days) |
|---|---|
| 2 | 181 |
| 4 | 91 |
| 8 | 46 |
| 16 | 23 |
| 32 | 11 |
| 64 | 6 |
| 80 | 5 |
| 96 | 4 |
| 128 | 3 |
| 365 | 1 |
RESULTS
Usage data
Glyphosate was applied to 176 commodities or sites in California in 20229 (Supplementary file Table S1). Seven glyphosate forms were applied, with isopropylamine and potassium salts accounting for 48.37% and 40.70% of 430 entries, respectively (Figure 2A; and Supplementary file Table S2).
Figure 2
Glyphosate usage in California in 2022: A) Percentage of all data entries by glyphosate form (the glyphosate forms are denoted as following: 1) glyphosate, 2) glyphosate, diammonium salt, 3) glyphosate, dimethylamine salt, 4) glyphosate, isopropylamine salt, 5) glyphosate, monoammonium salt, 6) glyphosate, potassium salt, and 7) glyphosate-trimesium); B) Percentage of data entries included in the assessment by glyphosate form (the glyphosate forms are denoted as in panel A); C) Histogram of glyphosate application rates included in the assessment (the ‘Count’ refers to the number of glyphosate application entries highlighted in Supplementary file Table S1); D) Summary of application rates (the 10th, 25th, 50th, 75th, and 90th percentiles are depicted using a box plot, and the values corresponding to the minimum, median, mean, 95th percentile, and maximum values are specified on the graph)
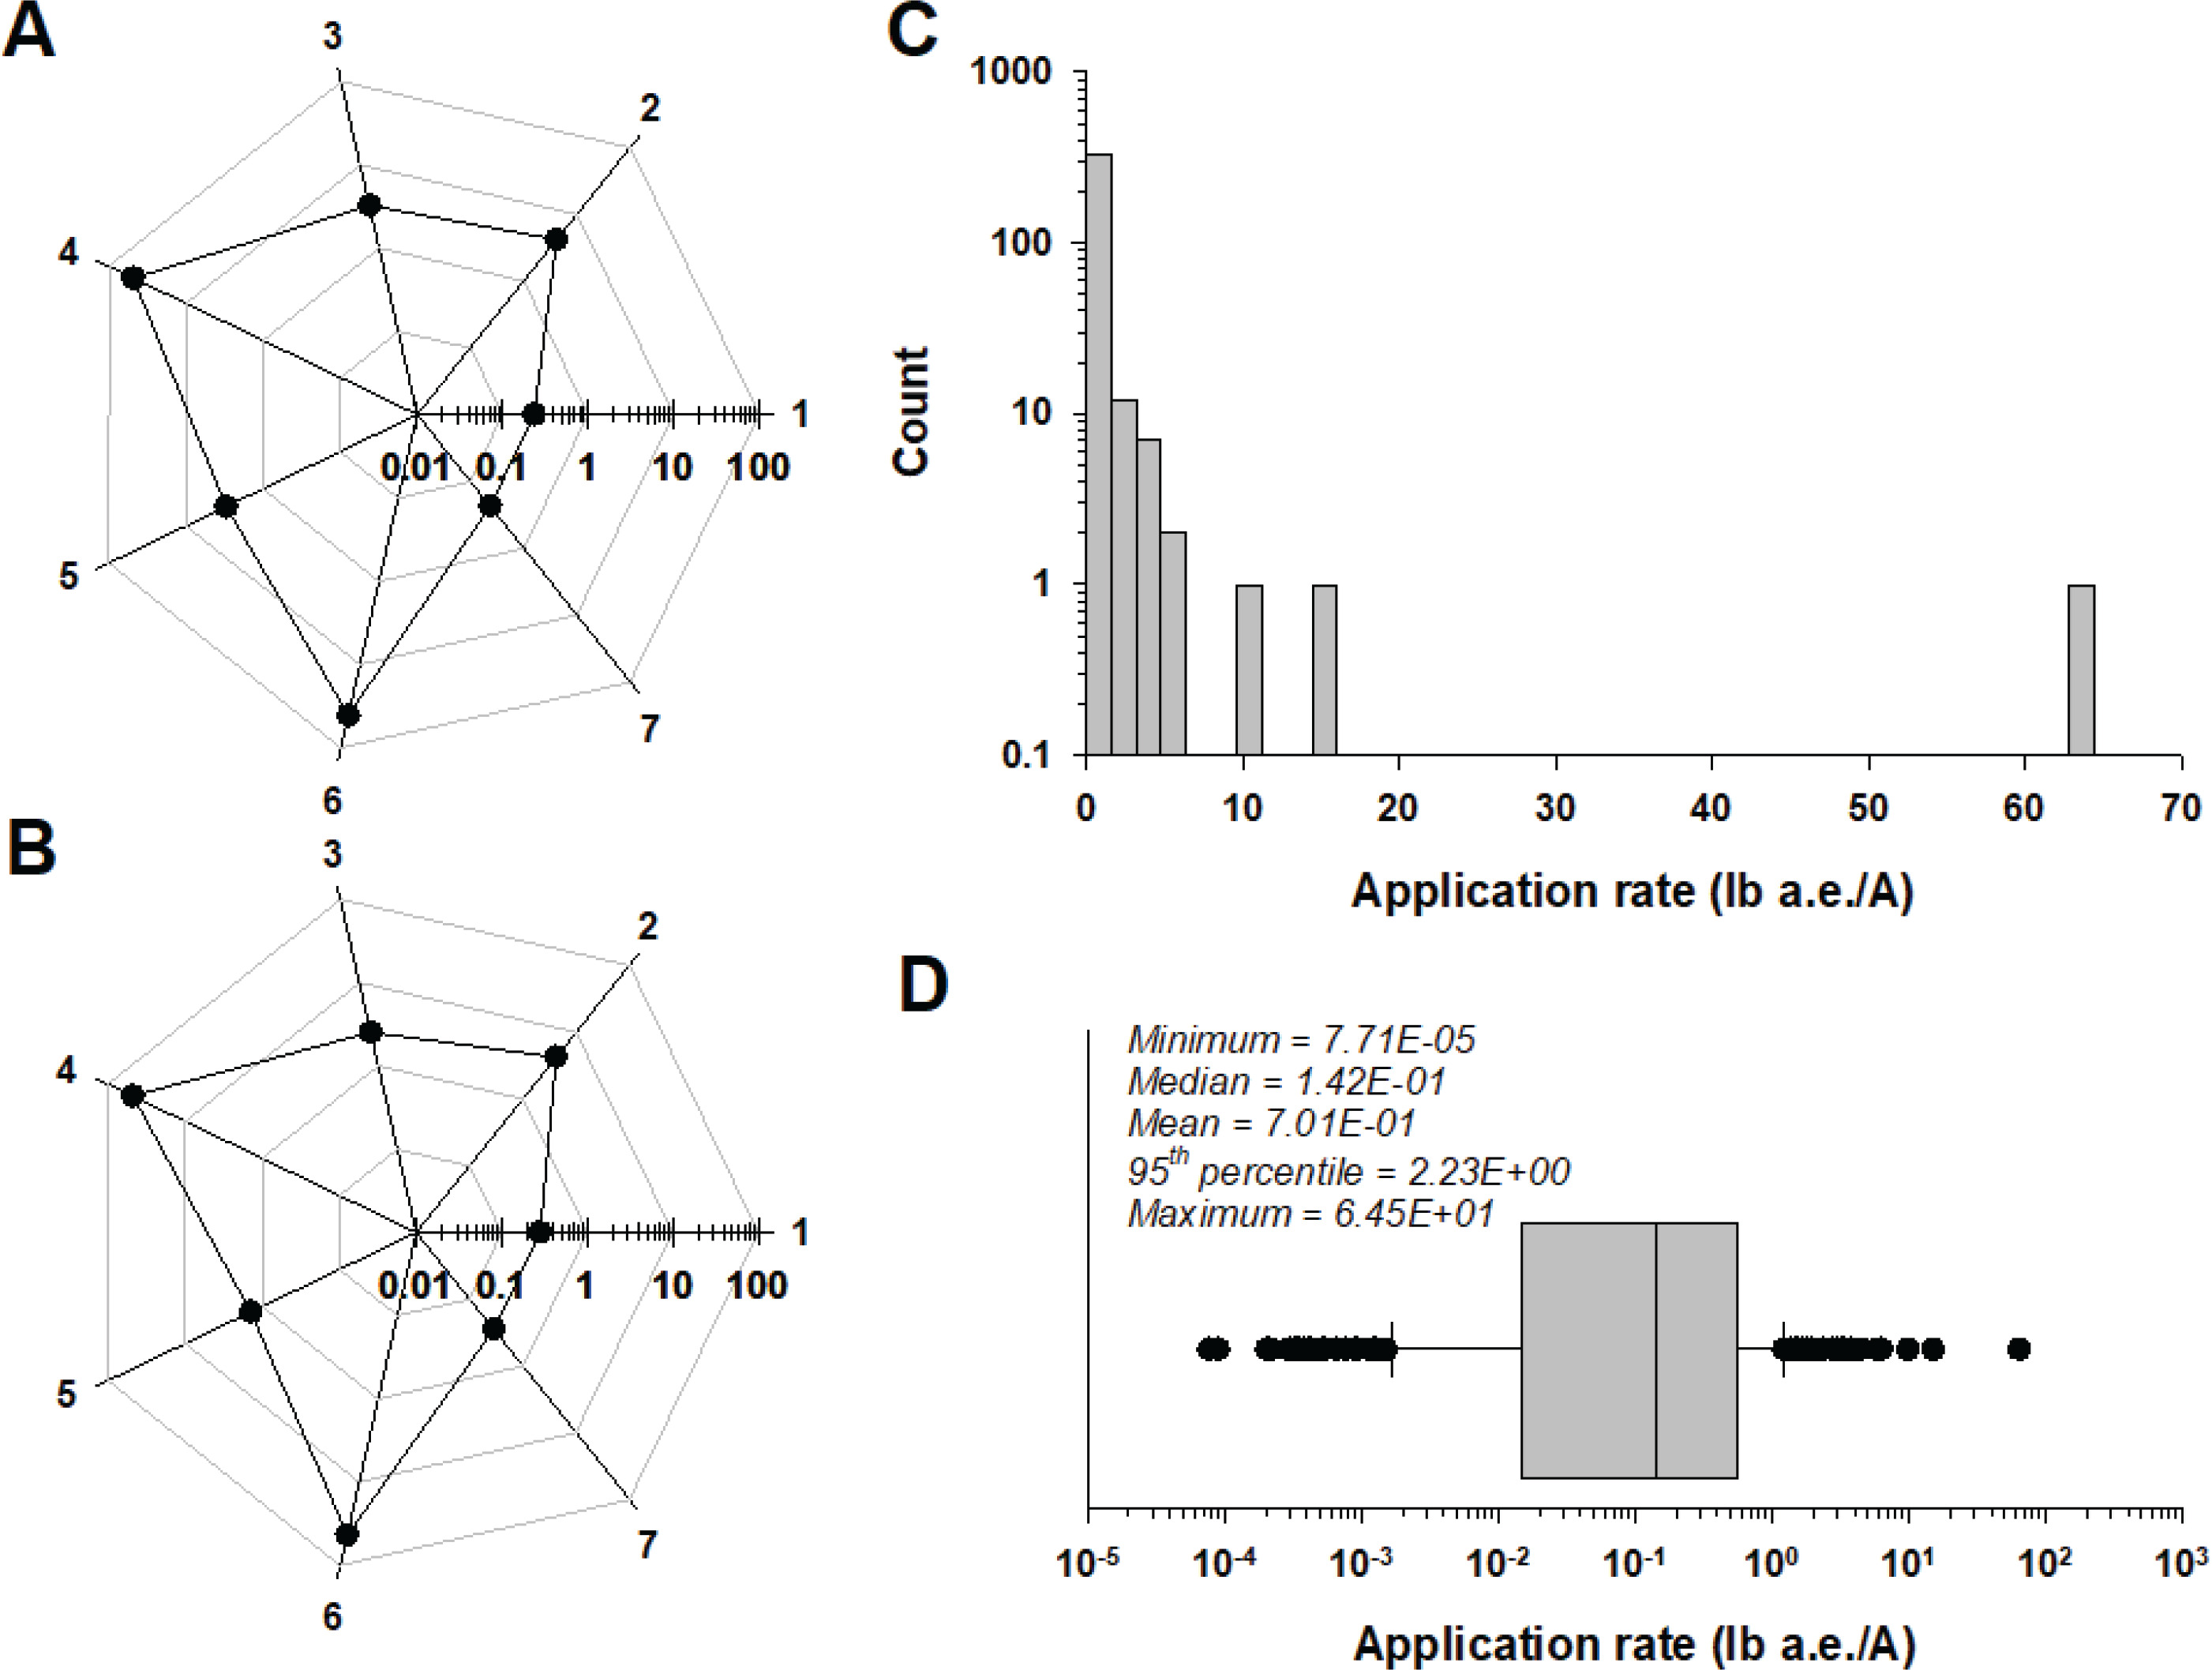
The dataset (Supplementary file Table S1) was filtered as described in the Methods. The resulting dataset contained 354 entries corresponding to 172 commodities or sites. The distribution of glyphosate forms remained practically the same as the original dataset, with isopropylamine and potassium salts accounting for 48.02% and 43.22% of 354 entries, respectively (Figure 2B; and Supplementary file Table S2). For most uses, the application rates were ≤5.64 lb a.e./acre (Figure 2C). The minimum, median, mean, 95th percentile, and maximum application rates were 7.70×10⁻⁵, 1.42×10⁻¹, 7.01×10⁻¹, 2.23, and 64.5 lbs a.e./acre, respectively (Figure 2D); these rates were used for risk assessment.
Risk assessment – honeybees
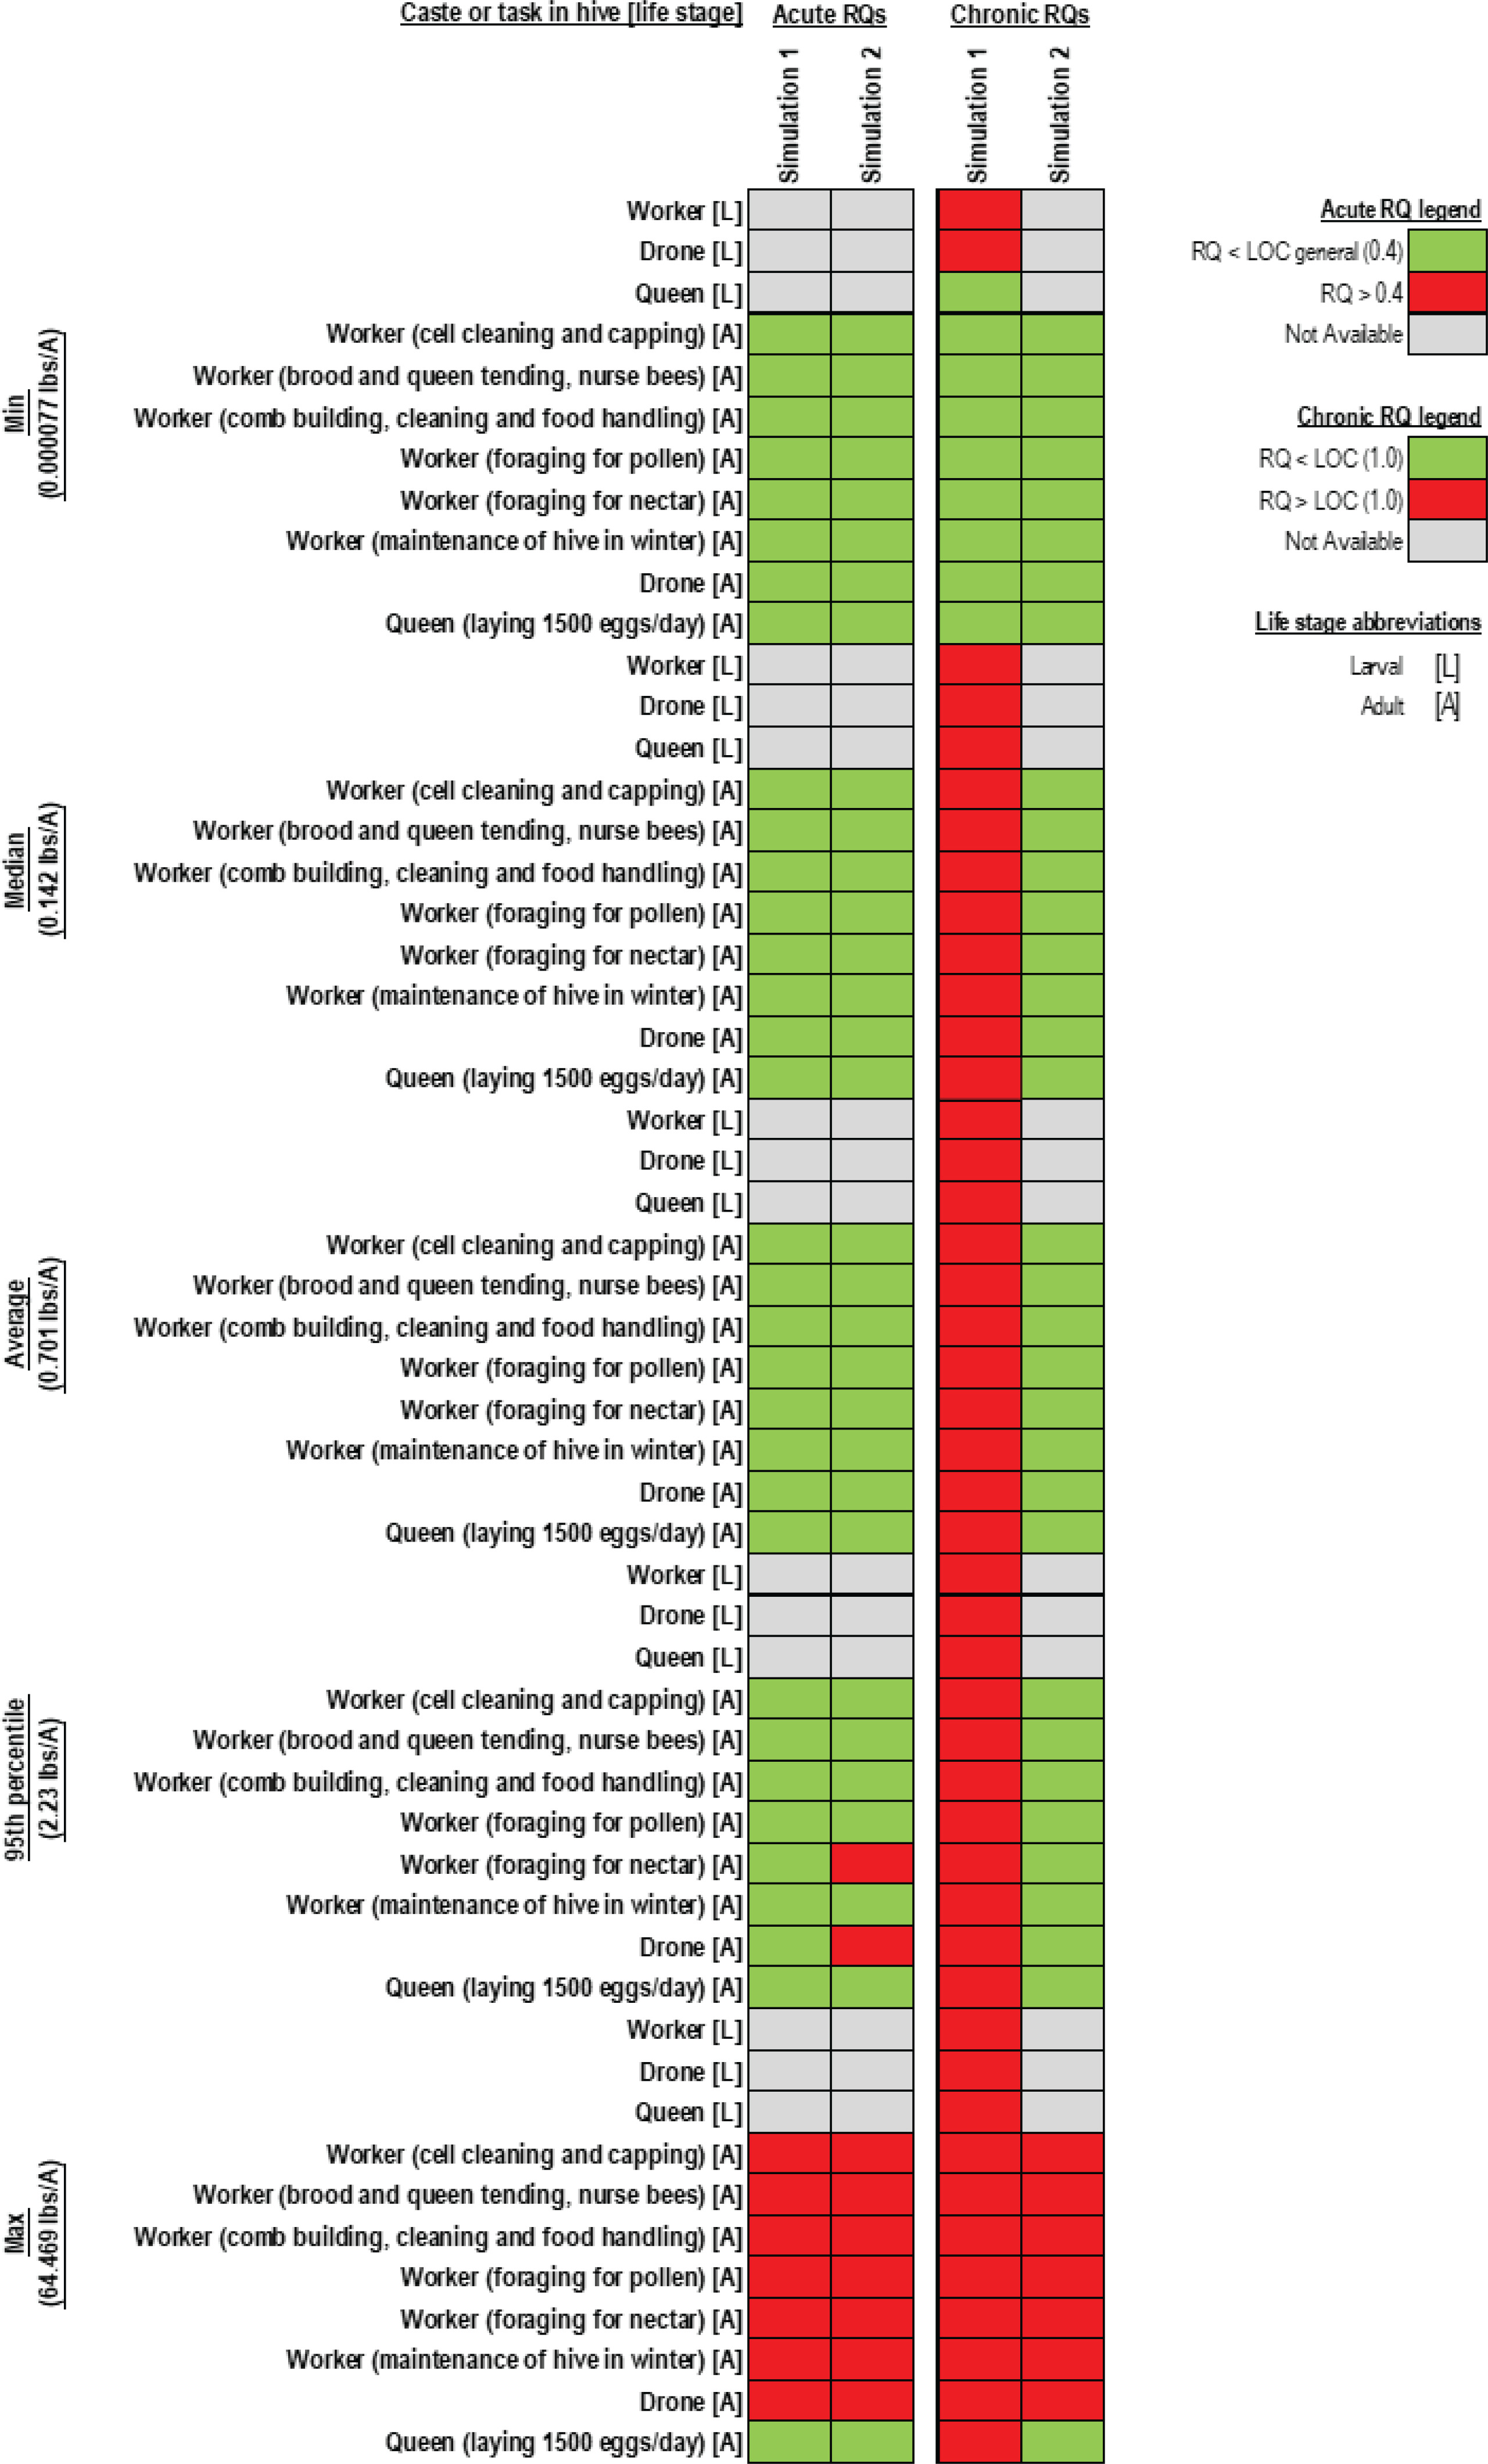
Two acute toxicity thresholds were identified in ECOTOX (i.e. oral LD50 values of >103 and >182 μg/bee in adult honeybees); the same acute oral toxicity thresholds were noted in EPA16. An acute contact LD50 of >100 μg/bee for adult honeybees was noted in EPA16. Notably, these LD50 values were non-definitive (i.e. true toxic dose unknown, since no effects were observed at the highest dose tested). For chronic toxicity, the following NOAEL values were identified in ECOTOX: 0.0025 and >182 μg/bee (adult honeybees) and 1.3×10⁻⁴ μg/bee (larval honeybees). Based on these toxicity thresholds, the potential acute and chronic risks posed to honeybees were evaluated as summarized in Figure 3 and detailed below. The acute and chronic LOCs were 0.4 and 1, respectively.
Figure 3
Acute and chronic RQs in honeybees across different life stages/castes, toxicity thresholds, and application rates by foliage spray. For information on toxicity thresholds used in the simulations see Table 2
Acute toxicity
Table 2
Toxicity thresholds used to evaluate the acute and chronic toxicity of glyphosate in honeybees, herpetofauna, birds, and mammals
| Toxicity threshold (species) | Source | Ecological receptor (simulation number) | |||
|---|---|---|---|---|---|
| Honeybees | Herpetofauna | Birds | Mammals | ||
| Acute | |||||
| LD50 >182 (adult honeybee) | ECOTOX | ● (1) | |||
| LD50 >100 (adult honeybee) | EPA (2015) | ● (2) | |||
| LD50 >1750 mg/kg (western fence lizard)† | ECOTOX | ● (1) | |||
| LD50=4570 mg/kg (mallard duck) | EPA (2015) | ● (1) | |||
| LD50 >2000 mg/kg (bobwhite quail) | ECOTOX | ● (2) | ● (2) | ||
| LD50=3196 mg/kg (bobwhite quail) | EPA (2015) | ● (3) | ● (3) | ||
| LD50=3139 mg/kg (canary)† | EPA (2015) | ● (4) | ● (4) | ||
| LC50=4971 ppm (mallard duck) | EPA (2015) | ● (5) | ● (5) | ||
| LC50 >5200 ppm (bobwhite quail) | ECOTOX | ● (6) | ● (6) | ||
| LD50=1568 mg/kg (mouse) | NTP (1992) | ● (1) | |||
| LD50=4873 mg/kg (rat) | NTP (1992) | ● (2) | |||
| Chronic | |||||
| NOAEL=0.0025 μg/bee (adult honeybee) | ECOTOX | ● (1) | |||
| NOAEL=0.00013 μg/bee (larval honeybee) | ECOTOX | ● (1) | |||
| NOAEL >182 μg/bee (adult honeybee) | ECOTOX | ● (2) | |||
| NOEC <501 ppm (mallard duck) | EPA (2015) | ● (1) | ● (1) | ||
| NOEC =830 ppm (bobwhite quail) | EPA (2015) | ● (2) | ● (2) | ||
| NOEC=1000 ppm (western capercaillie)† | ECOTOX | ● (3) | ● (3) | ||
| NOEC=3470 ppm (Japanese quail)† | ECOTOX | ● (4) | ● (4) | ||
| NOAEC=3125 ppm (mouse) | ECOTOX | ● (1) | |||
| NOAEL=30 mg/kg (rat) | EPA (2015) | ● (2) | |||
The potential risk in honeybees following acute glyphosate exposure depended on the caste of the honeybee and life stage. Based on glyphosate toxicity data from ECOTOX [i.e. LD50 =182 μg/bee (Simulation 1)], the acute LOC was exceeded only at the maximum application rate of 64.5 lbs/acre for all castes except for queen honeybees. Conversely, using EPA16 data [i.e. LD50=100 μg/bee (Simulation 2)], the acute LOC was exceeded at the 95th percentile application rate of 2.23 lbs/acre for worker honeybees foraging for nectar and for drones. Based on Simulation 2, the maximum glyphosate application rate at which the acute LOC would not be exceeded was 1.25 lbs/acre (Supplementary file).
Chronic toxicity
Larval chronic toxicity data were only available for Simulation 1 (i.e. NOAEL=0.00013 μg/bee), and the chronic LOC was exceeded at all application rates. Specifically, the minimum application rate of 7.70×10⁻⁵ lbs/acre resulted in exceedances for honeybees in all castes, with the exception of larval queens, for which the chronic LOC was exceeded at the median application rate of 0.142 lbs/acre. Regarding adult honeybees, the chronic LOC was exceeded at the median application rate of 0.142 lbs/acre in Simulation 1 (NOAEL=0.0025 μg/bee), whereas in Simulation 2 (NOAEL=182 μg/bee), the chronic LOC was exceeded at the maximum application rate of 64.5 lbs/acre. Based on Simulation 1, the maximum glyphosate application rate at which the chronic LOCs would not be exceeded was 8.85×10⁻⁶ lbs/acre (Supplementary file).
Risk assessment – herpetofauna
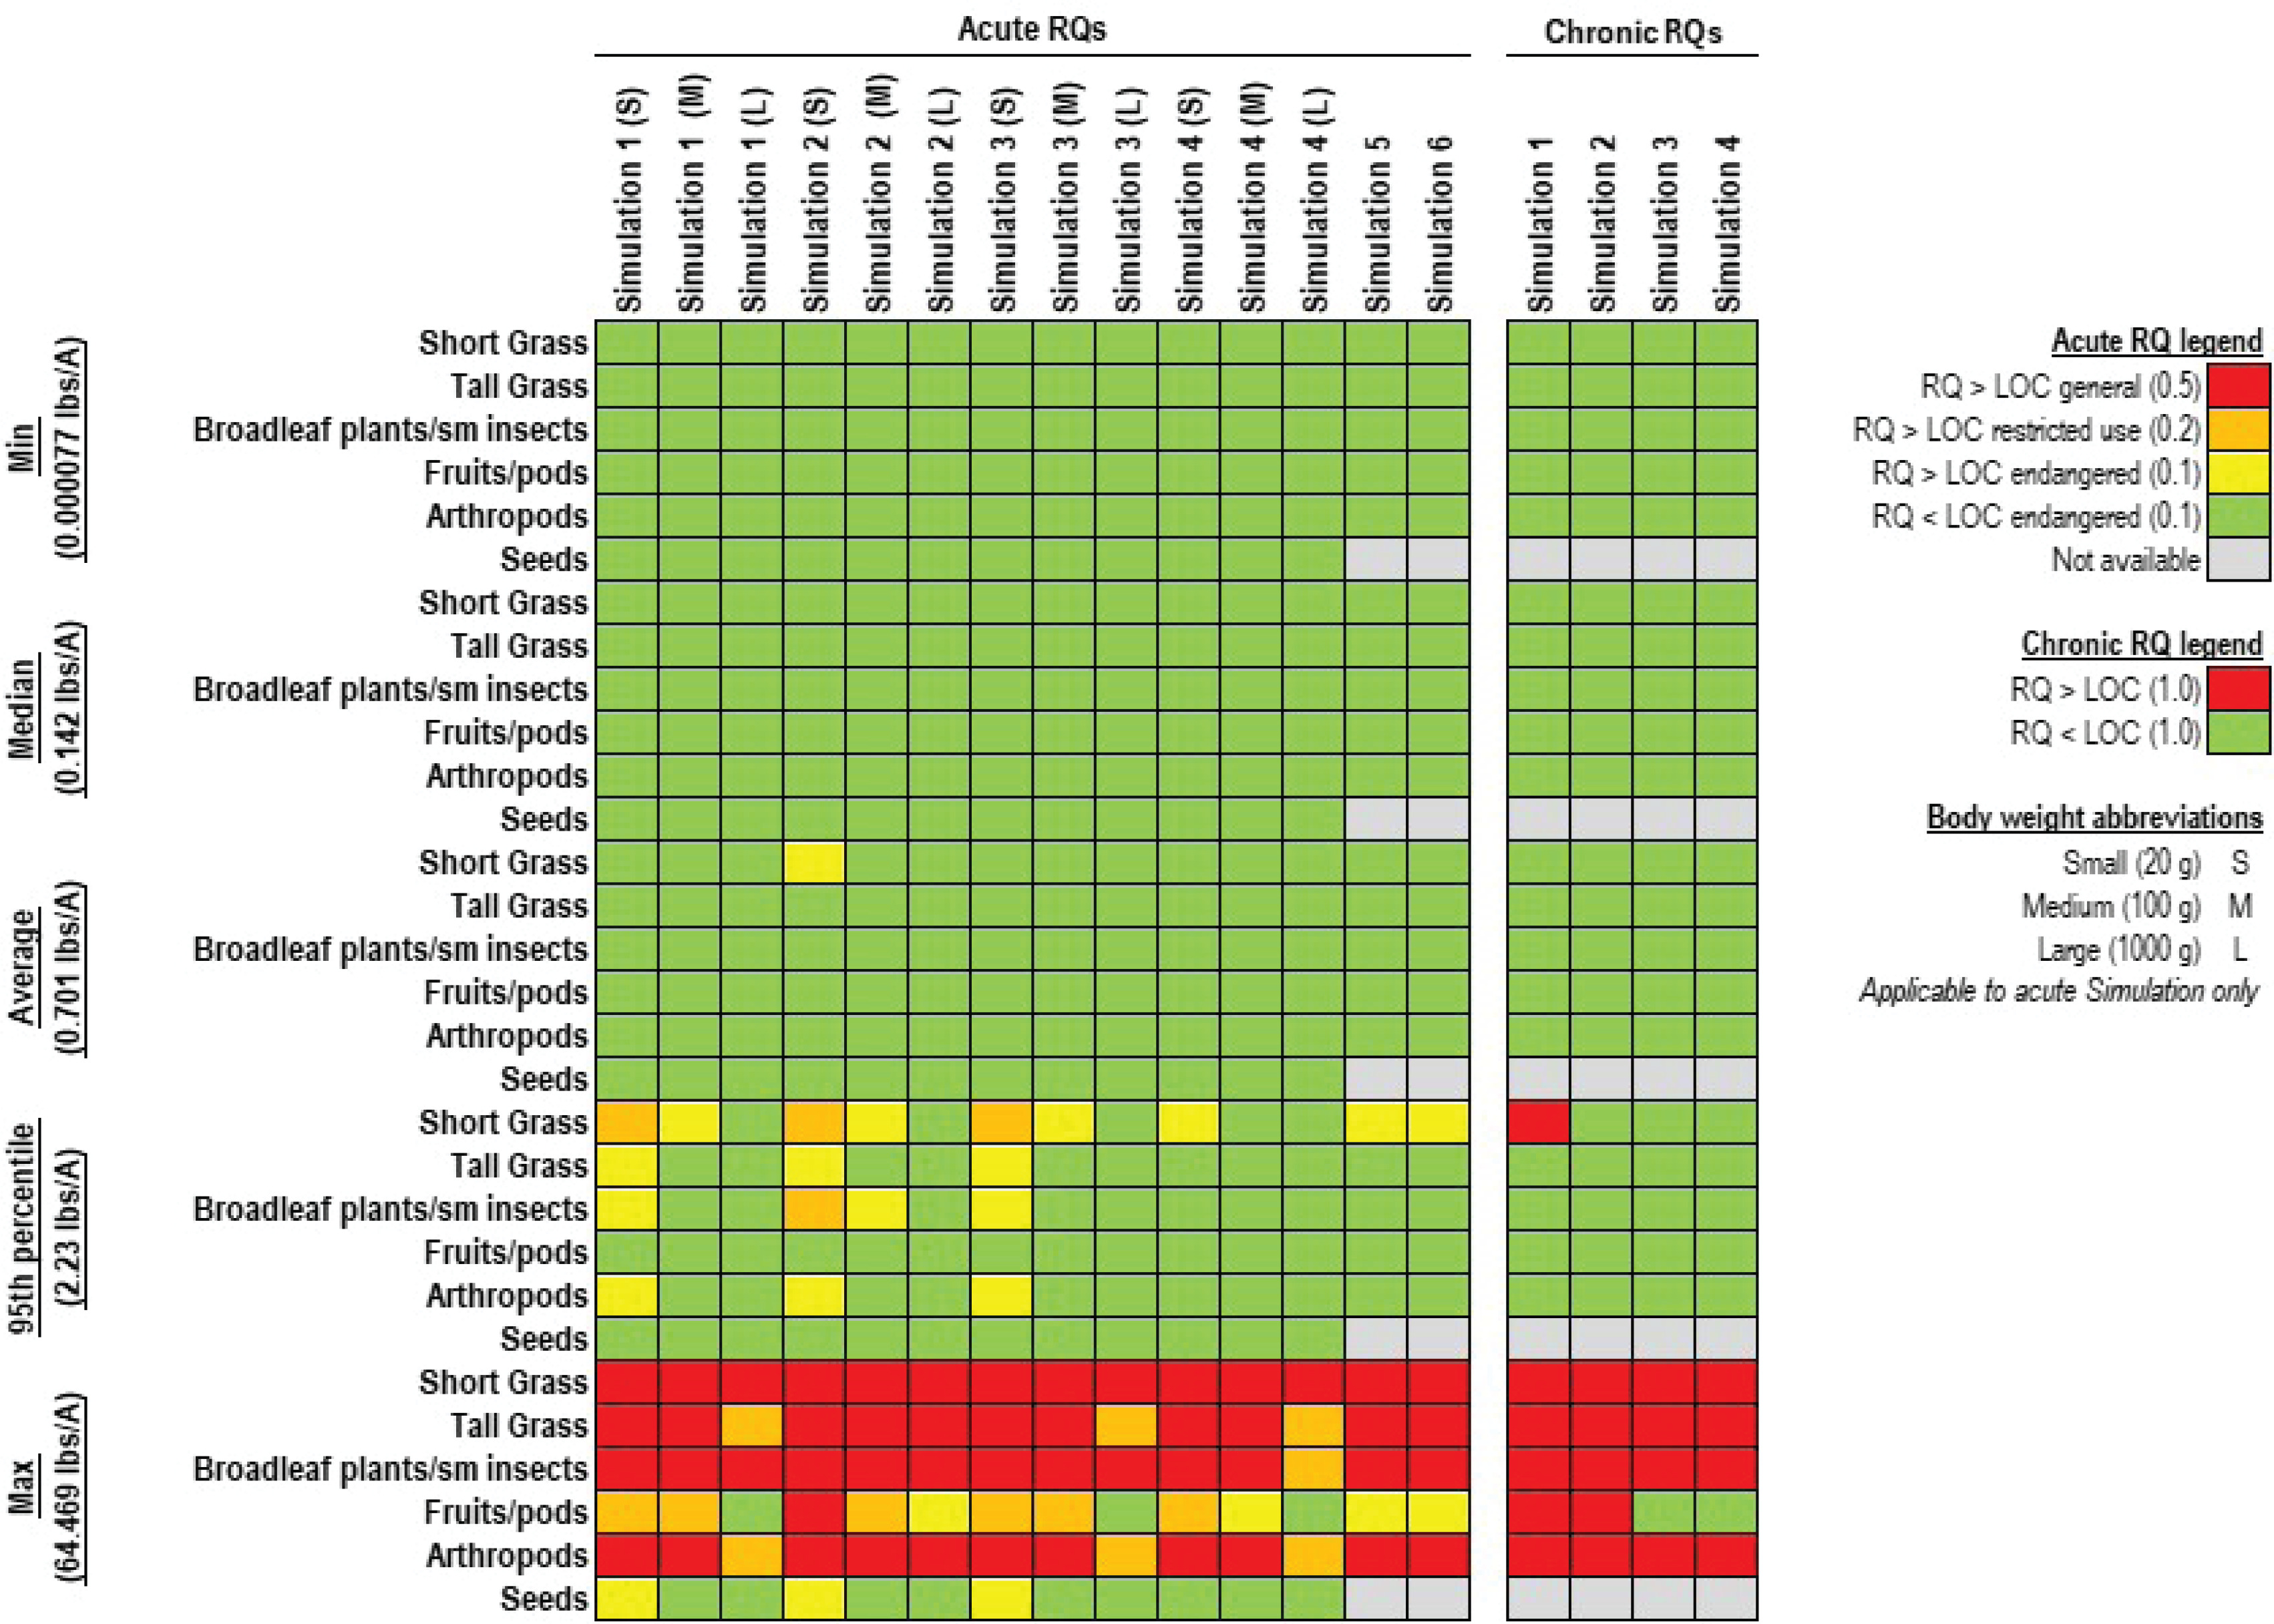
A single toxicity threshold was identified for reptiles (i.e. LD50 >1750 mg/kg). However, since T-HERPS permits the use of avian surrogate data, several acute and chronic toxicity thresholds for birds available in ECOTOX and EPA16 were included (Table 2). These toxicity thresholds were used to run simulations for acute and chronic toxicity as summarized in Figure 4 and outlined below. The acute LOCs were 0.05 (endangered species), 0.1 (restricted use), and 0.5 (general), whereas the chronic LOC was 1.
Figure 4
Acute and chronic RQs in herpetofauna across different food items, body weight assumptions, toxicity thresholds, and application rates. For information on toxicity thresholds used in the simulations see Table 2
Acute toxicity
No exceedances of acute LOCs occurred at or below the average glyphosate application rate (i.e. 0.701 lbs/acre) except for an exceedance in medium-sized reptiles under Simulation 1 and another exceedance under Simulation 2; however, for these simulations, the LD50 values were >1750 and >2000 mg/kg, respectively. Acute LOCs were exceeded at or above the glyphosate application rate corresponding to the 95th percentile (i.e. 2.23 lbs/acre), depending on the food item and the LD50/LC50 assumption. Simulation 1 (i.e. reptile LD50=1750 mg/kg) yielded the most conservative acute RQs; based on which, the maximum glyphosate application rate at which none of the acute LOCs would be exceeded was 0.58 lbs/acre (Supplementary file).
Chronic toxicity
No exceedances of chronic LOC occurred at or below the average glyphosate application rate (i.e. 0.701 lbs/acre). The chronic LOC was exceeded at or above the 95th percentile glyphosate application rate (i.e. 2.23 lbs/acre), depending on the food item and the NOEC assumption. Simulation 1 (i.e. mallard duck NOEC <501 ppm) yielded the most conservative RQs; based on which, the maximum glyphosate application rate at which the chronic LOC would not be exceeded was 2.09 lbs/acre (Supplementary file).
Risk assessment – birds
Several acute and chronic toxicity thresholds were identified in ECOTOX and EPA16 (Table 2). The avian toxicity thresholds were used to run simulations for acute and chronic toxicity as summarized in Figure 5 and outlined below. The acute LOCs were 0.1 (endangered species), 0.2 (restricted use), and 0.5 (general), whereas the chronic LOC was 1.
Figure 5
Acute and chronic RQs in birds across different food items, body weight assumptions, toxicity thresholds, and application rates. For information on toxicity thresholds used in the simulations see Table 2
Acute toxicity
No exceedances of acute LOCs occurred at or below the average glyphosate application rate (i.e. 0.701 lbs/acre) except for a single exceedance in small-size birds consuming short grass (i.e. Simulation 2). Acute LOCs were exceeded at or above the glyphosate application rate corresponding to the 95th percentile (i.e. 2.23 lbs/acre), depending on the food item and the LD50/LC50 assumption. Simulation 2 (i.e. bobwhite quail LD50=2000 mg/kg) yielded the most conservative acute RQs; based on which, the maximum glyphosate application rate at which none of the acute LOCs would be exceeded was 0.53 lbs/acre (Supplementary file).
Chronic toxicity
No exceedances of chronic LOC occurred at or below the 95th percentile of glyphosate application rate (i.e. 2.23 lbs/acre), except for birds in Simulation 1 consuming short grass. Simulation 1 (i.e. mallard duck NOEC <501 ppm) yielded the most conservative RQs; based on which, the maximum glyphosate application rate at which the chronic LOC would not be exceeded was 2.09 lbs/acre (Supplementary file).
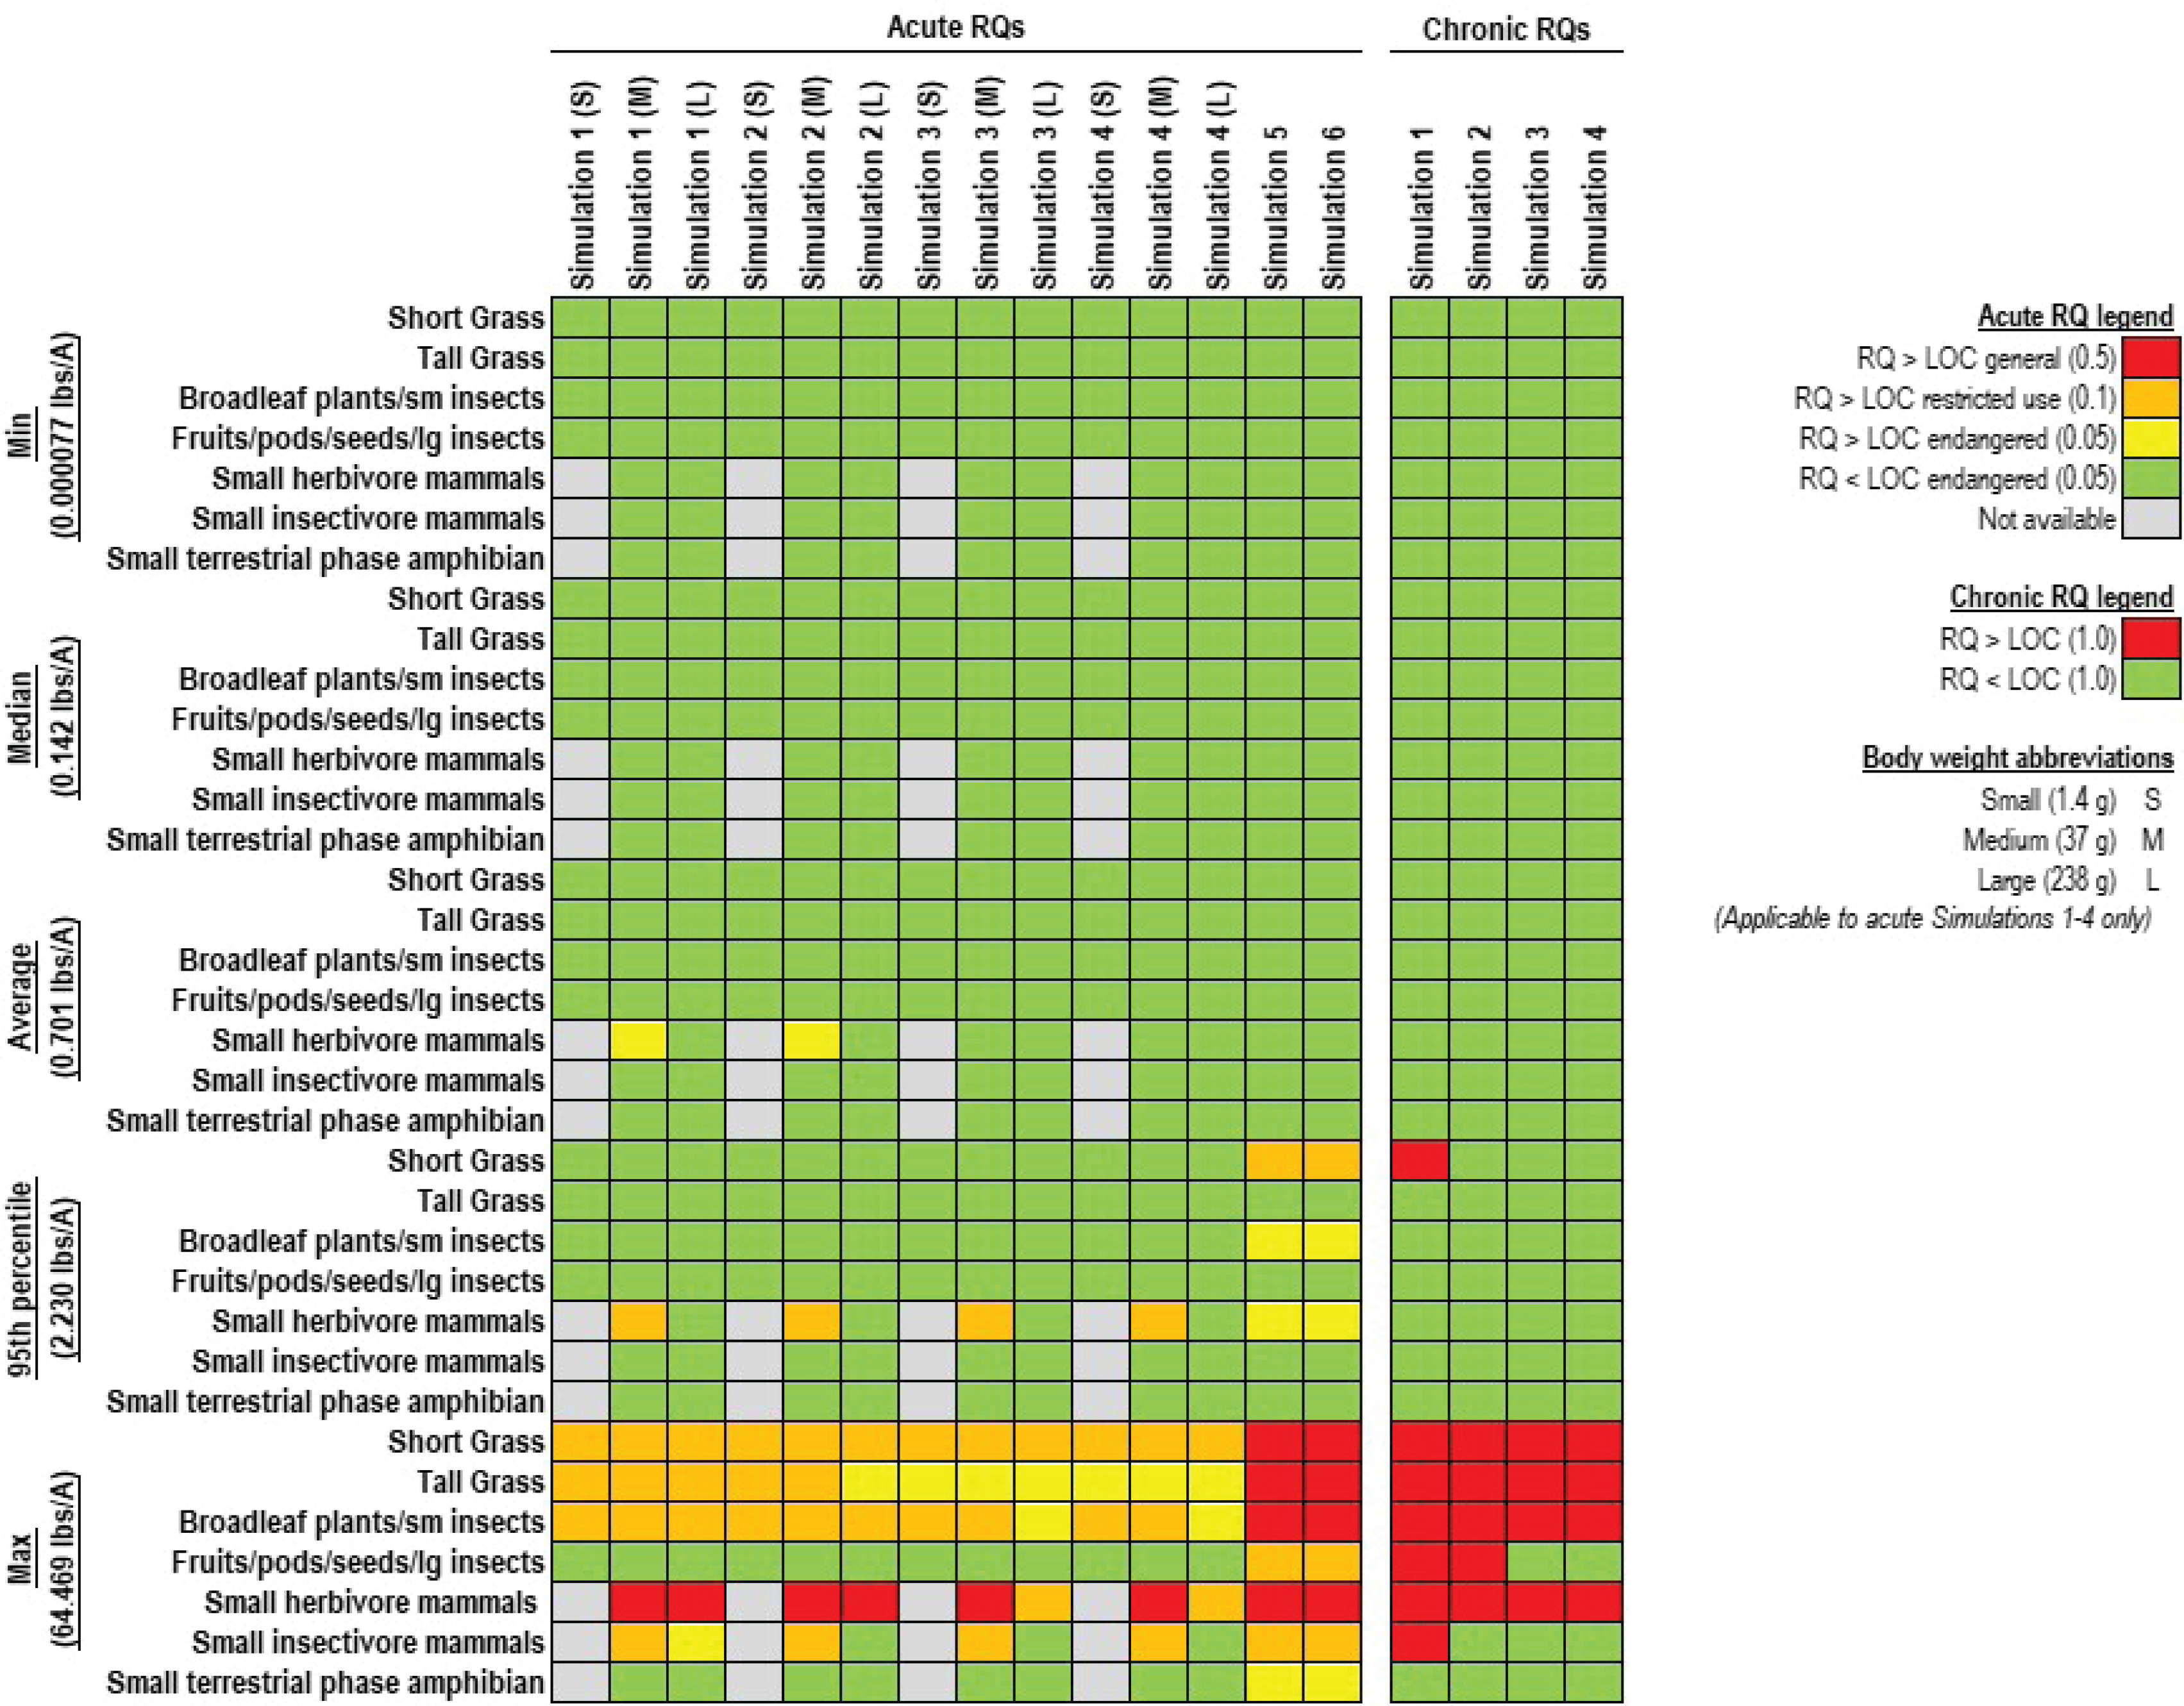
Risk assessment – mammals
No acute toxicity thresholds for mammals were identified in ECOTOX. Per EPA16, the non-definitive LD50 values ranged from >1920 to >4860 mg/kg; however, per the National Toxicology Program (NTP) report by Chan and Mahler20, the glyphosate LD50 values in mice and rats were 1568 and 4873 mg/kg, respectively, and were used for acute Simulations 1 and 2, respectively. Notably, T-REX uses a default animal body weight of 350 g (i.e. average rat body weight); thus, for Simulation 1, the body weight was adjusted to 30 g (i.e. average mouse body weight).
Several chronic toxicity thresholds were identified in ECOTOX. The lowest reported NOAEC was 3125 ppm diet for mice, which was used in chronic Simulation 1. In chronic Simulation 2, a rat NOAEL of 30 mg/kg was used per EPA16. The acute and chronic toxicity results are summarized in Figure 6 and outlined below. The acute LOCs were 0.1 (endangered species), 0.2 (restricted use), and 0.5 (general), whereas the chronic LOC was 1.
Figure 6
Acute and chronic RQs in mammals across different food items, body weight assumptions, toxicity thresholds, and application rates. For information on toxicity thresholds used in the simulations see Table 2
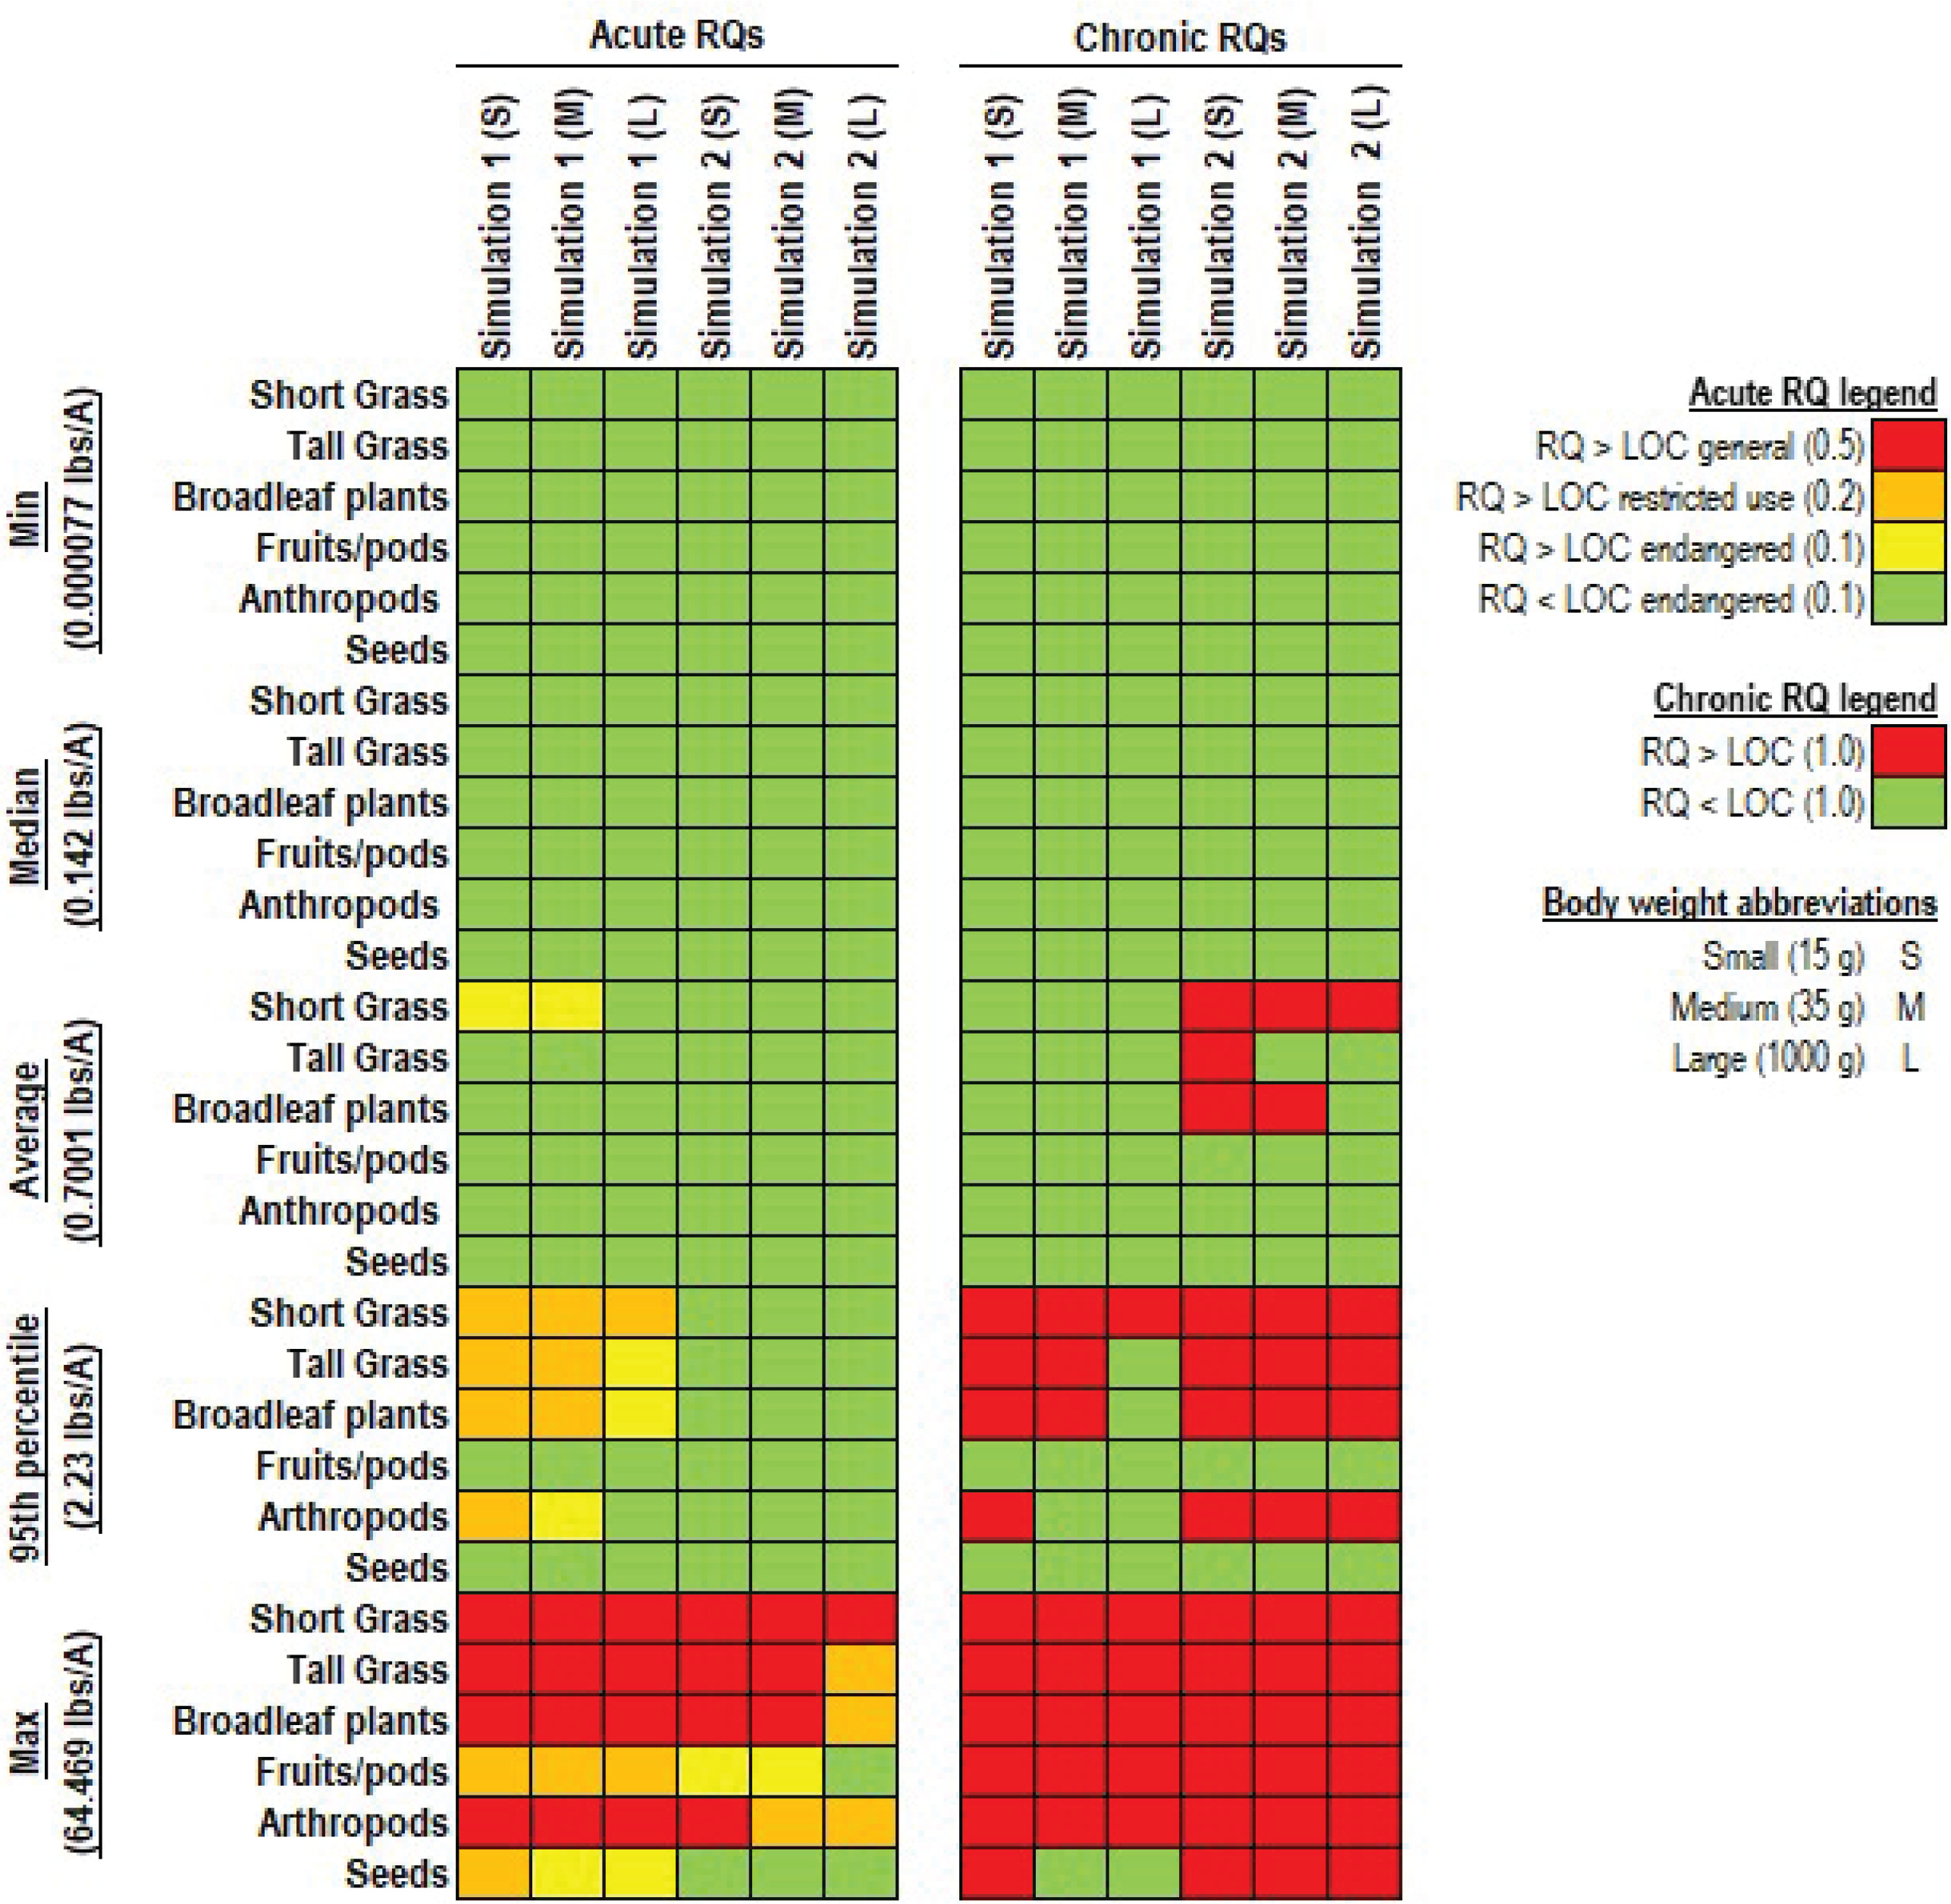
in Figure 6 and outlined below. The acute LOCs were 0.1 (endangered species), 0.2 (restricted use), and 0.5 (general), whereas the chronic LOC was 1.
Acute toxicity
No exceedances of acute LOCs occurred at or below the average glyphosate application rate (i.e. 0.701 lbs/acre) except for two exceedances in small- and medium-sized mammals under Simulation 1. Acute LOCs were exceeded at or above the glyphosate application rate corresponding to the 95th percentile (i.e. 2.23 lbs/acre), depending on the food items and the LD50 assumption. Simulation 1 (i.e. mouse LD50=1568 mg/kg) yielded the most conservative acute RQs; based on which, the maximum glyphosate application rate at which none of the acute LOCs would be exceeded was 0.81 lbs/acre (Supplementary file).
Chronic toxicity
No exceedances of chronic LOC occurred at or below the median glyphosate application rate (i.e. 0.142 lbs/acre). The chronic LOC was exceeded at or above the average glyphosate application rate (i.e. 0.701 lbs/acre), depending on the food item and the toxicity threshold assumption. Based on this simulation, the maximum glyphosate application rate at which none of the chronic LOCs would be exceeded was 0.29 lbs/acre (Supplementary file).
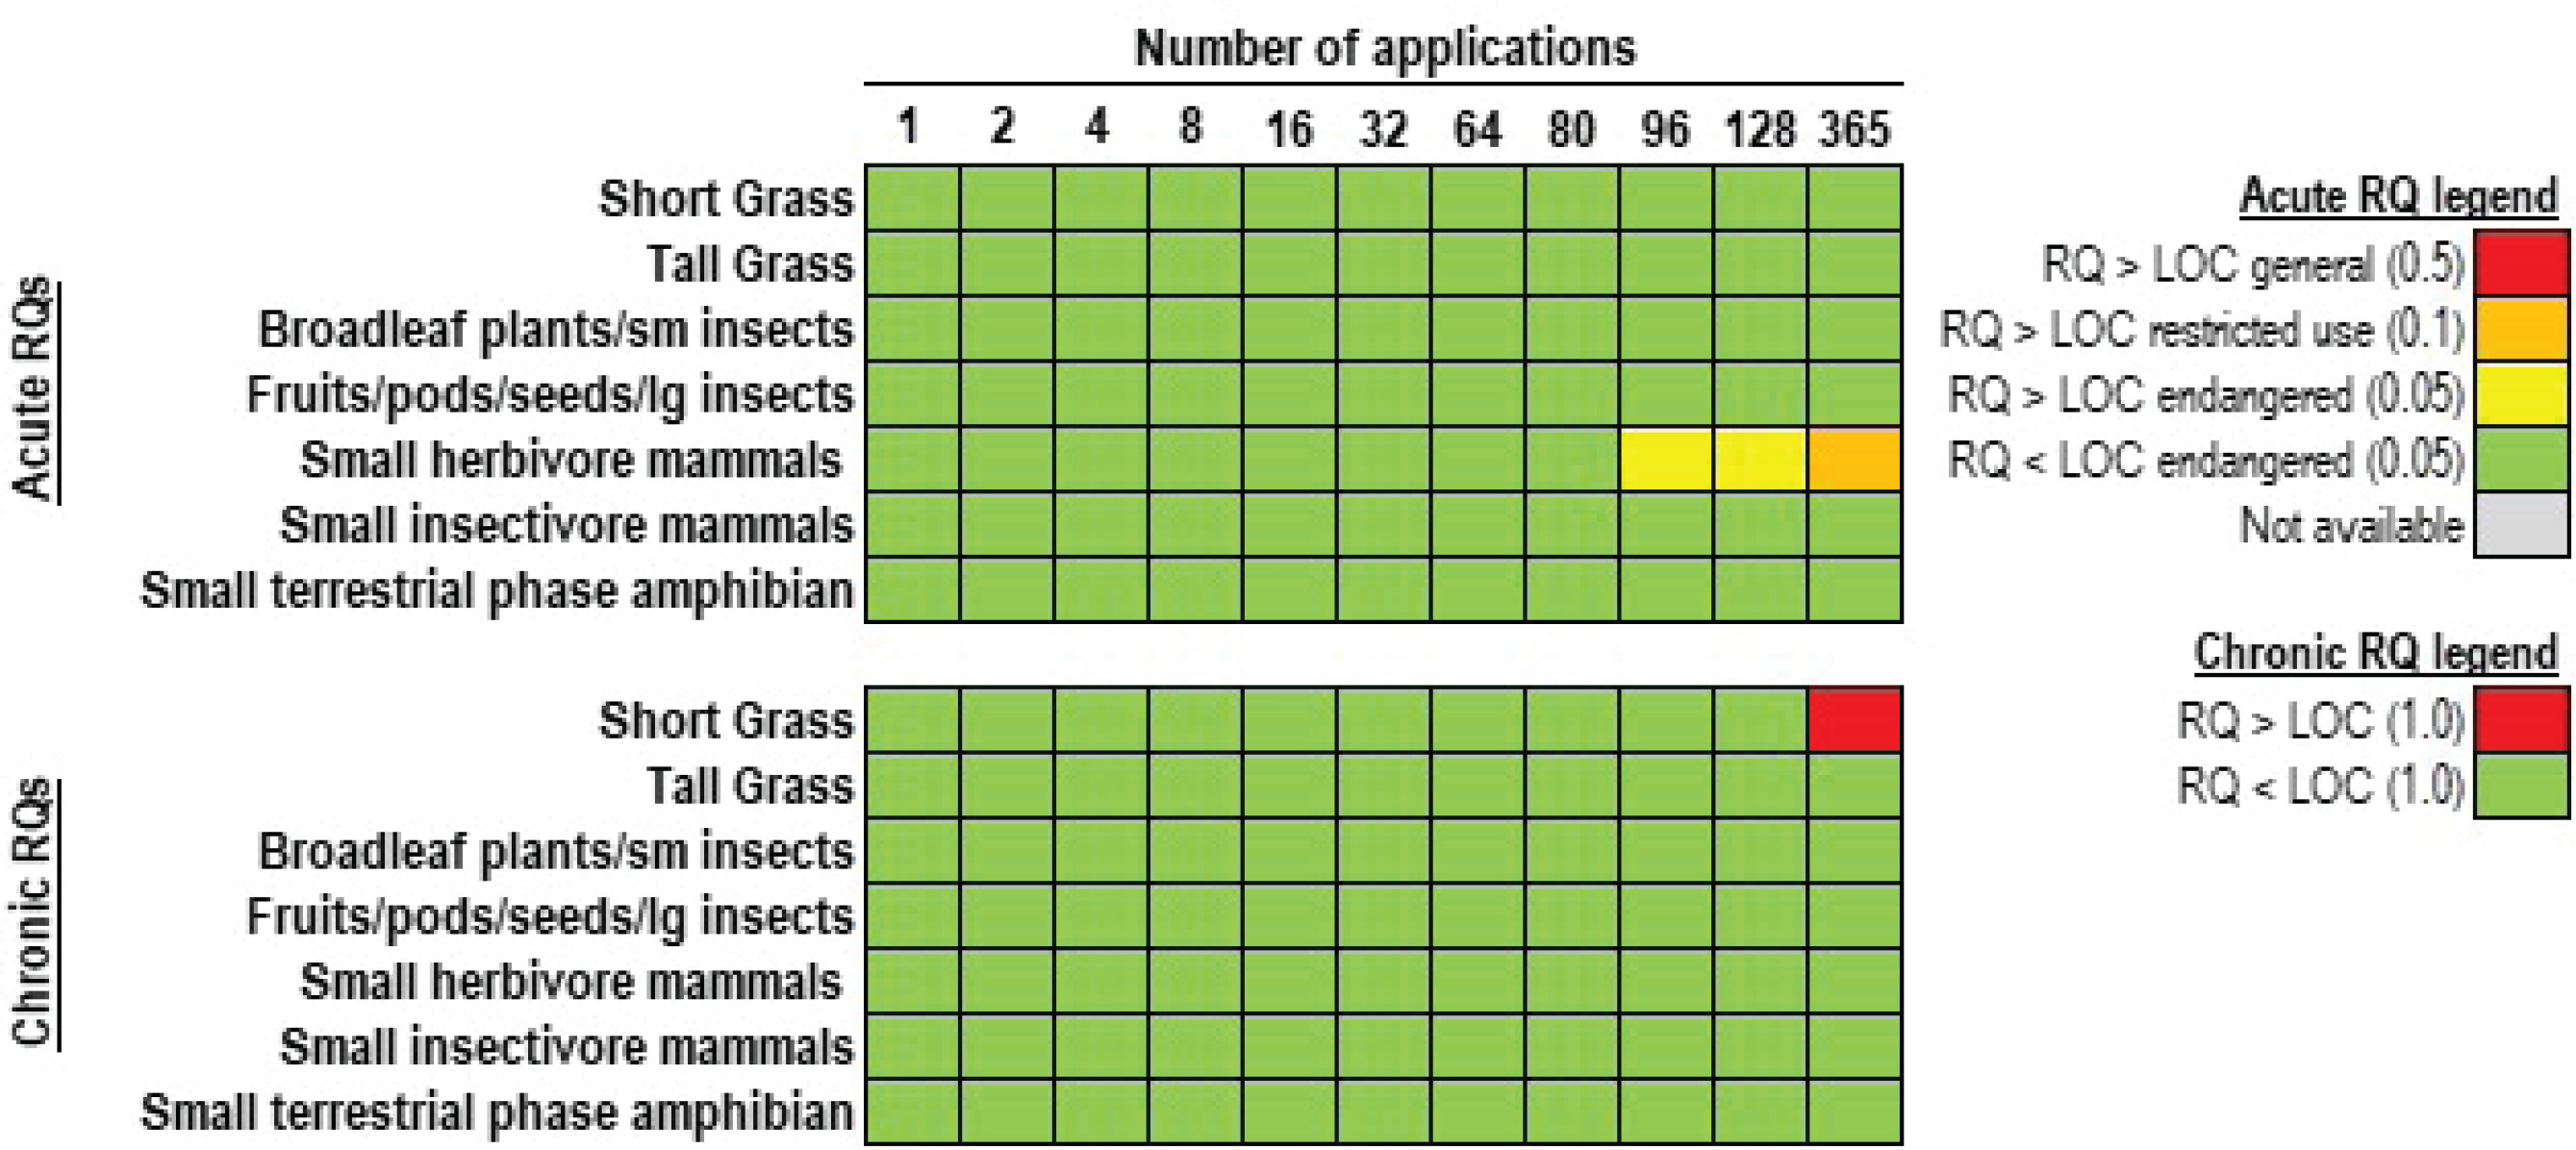
Sensitivity analysis
Sensitivity analysis performed in herpetofauna as a proof-of-concept using the median application rate of 0.142 lbs/acre, several application scenarios, reptile LD50 of 1750 mg/kg, and mallard duck NOEC of 501 ppm showed that the acute RQs remained below the acute LOCs up to 80 applications annually (one application every five days), whereas the chronic RQs remained below the chronic LOC up to 128 applications annually (one application every three days) (Figure 7). Therefore, application of 0.142 lbs/acre glyphosate 80 times per year every five days would not pose a risk to herpetofauna. The application of 0.142 lbs/acre glyphosate 80 times per year yields a cumulative application rate of 11.36 lbs/acre glyphosate, which is about 6-fold lower than the maximum application rate of 64.47 lbs/acre.
Figure 7
Sensitivity analysis in herpetofauna depicting the effect of annual application frequency (ranging from a single application per year to 365 applications per year) on acute and chronic risk quotients. The following assumptions were used: glyphosate application rate: 0.142 lbs/acre; LD50: 1750 mg/kg (reptile); NOEC: 501 ppm (mallard duck); application interval: ranges from 1 day (365 applications) to 181 (two applications) (see Table 1 for details)
DISCUSSION
The current study demonstrated the application of publicly available tools for risk assessment of pesticides in honeybees, herpetofauna, birds, and mammals. For honeybees, risks due to acute or chronic glyphosate exposures at either the larval or adult life stages were considered high. Although for acute exposure, LOC exceedances only occurred at the 95th percentile and maximum application rates, for chronic exposure, LOC exceedances occurred at all application rates. The maximum glyphosate application rate that would not exceed the acute and chronic LOCs was 8.85×10⁻⁶ lbs/acre, supporting the high likelihood of risk, since the minimum glyphosate application rate in California was 7.70×10⁻⁵ lbs/acre. The maximum rate of 8.85×10⁻⁶ lbs/acre was based on an oral NOAEL of 1.3×10⁻⁴ μg/bee following observations of sublethal effects reported by Tomé et al.21, which included reduced survival rates, increased antennal abnormalities, and altered gene expression patterns and acini size.
Risks to herpetofauna due to acute or chronic glyphosate exposures were considered low. For acute exposure, LOC exceedances primarily occurred at the 95th percentile and maximum application rates. Although LOC exceedances occurred for acute Simulations 1 and 2, these simulations were based on non-definitive LD50 values of >1750 and >2000 mg/kg. The maximum glyphosate application rate at which none of the acute LOCs would be exceeded was 0.58 lbs/acre, further supporting low risk. The maximum rate of 0.58 lbs/acre was based on a non-definitive LD50 of >1750 mg/kg in western fence lizard (Sceloporus occidentalis) exposed orally to a single dose of 1750 mg/kg glyphosate in gelatin capsules reported by Weir et al.22. The authors concluded that glyphosate (and other pesticides) used on public lands in New Zealand appeared to pose little risk of mortality to reptiles22. Bernal et al.23 reported 96-hour LC50 values of 4.0–20.3 lbs/acre in juvenile frogs administered a glyphosate formulation, further supporting the low likelihood of acute effects in herpetofauna; these LC50 values correspond to glyphosate application rates that are 2- to 9-fold higher than the 95th percentile application rate of 2.23 lbs/acre.
For chronic exposure in herpetofauna, a single LOC exceedance occurred at an application rate corresponding to the 95th percentile and several exceedances occurred at the maximum application rate. The maximum glyphosate application rate at which the chronic LOC would not be exceeded was 2.09 lbs/acre, further supporting low likelihood of risk. The maximum rate of 2.09 lbs/acre was based on a non-definitive NOEC of <501 ppm in mallard duck per EPA16, which cited a 1999 study ‘MRID 48876602’ that was not publicly available. According to EPA16, effects on body weights in males and offspring occurred at the dietary concentration of 501 ppm; however, EPA noted that no reproductive effects were reported in other studies in birds. Given that the rate of 2.09 lbs/acre (i.e. concentration at which no chronic effects are anticipated) is higher than the rate of 0.58 lbs/acre (i.e. concentration at which no acute effects are anticipated), adjusting glyphosate application rate to minimize acute effects would also minimize chronic effects.
Risks to birds due to acute or chronic glyphosate exposures were considered low. For acute exposure, LOC exceedances primarily occurred at the 95th percentile and maximum application rates. The maximum glyphosate application rate at which none of the acute LOCs would be exceeded was 0.53 lbs/acre, further supporting low likelihood of risk. The maximum rate of 0.53 lbs/acre was based on an LD50 of 2000 mg/kg in bobwhite quail.
For chronic exposure in birds, a single LOC exceedance occurred at the 95th percentile application rate in Simulation 1 small-size birds (20 g) consuming short grass. Several exceedances occurred at the maximum application rate, except for birds in Simulation 3 and 4 consuming fruits or pods. The maximum glyphosate application rate at which the chronic LOC would not be exceeded was 2.09 lbs/acre, which further supports low risk. The maximum rate of 2.09 lbs/acre was based on a non-definitive NOEC of <501 ppm in mallard duck per EPA16. Given that the rate of 2.09 lbs/acre (i.e. concentration at which no chronic effects are anticipated) is higher than the rate of 0.52 lbs/acre (i.e. concentration at which no acute effects are anticipated), adjusting glyphosate application rate to minimize acute effects would also minimize chronic effects.
For mammals, risks due to acute or chronic glyphosate exposures were considered low. For acute exposure, most LOC exceedances occurred at the 95th percentile and maximum application rates. Two exceedances occurred at the average application rate in small- and medium-sized mammals consuming short grass. The maximum glyphosate application rate at which none of the acute LOCs would be exceeded was 0.81 lbs/acre, further supporting low likelihood of risk. The maximum rate of 0.81 lbs/acre was based on a mouse LD50 of 1568 mg/kg per Chan and Mahler20.
Regarding chronic exposure in mammals, most LOC exceedances occurred at the 95th percentile and maximum application rates. Simulation 2 relied upon a NOAEL of 30 mg/kg from EPA16, which was the ‘highest dose tested’ in the study; however, the original dataset cited in the report was not available for review. When using the lowest reported chronic toxicity threshold reported in ECOTOX, chronic LOC exceedances occurred at the 95th percentile and maximum application rates. The maximum glyphosate application rate at which the chronic LOC would not be exceeded was 0.29 lbs/acre, further supporting low likelihood of risk.
Given LOC exceedances in some instances, discussion of risk mitigation strategies was warranted. For honeybees, a species survey could be conducted to determine their presence near the application site. In the absence of honeybees (or other pollinators), no risk is anticipated; however, if honeybees (or other pollinators) are present, additional action may be needed. For example, given that honeybees are attracted to flowering plants, glyphosate usage around flowering plants present at or adjacent to the sites of application could be restricted or glyphosate usage could be limited to seasons when no plant flowering occurs. Additionally, plants/crops differ in attractiveness to bees24, indicating that bee presence is more likely at sites with attractive plants/crops. Glyphosate applications can be timed to periods where pollinators are less active (e.g. early morning or late evening) to reduce exposure.
For herpetofauna, birds, and mammals, the models allow input of multiple applications. The sensitivity analysis performed in herpetofauna, as a proof-of-concept, revealed that glyphosate could be applied at a median application rate up to 80 times per year (approximately every five days) without LOC exceedances. The cumulative annual application rate resulting from 80 applications would be 11.36 lbs/acre, which is 5-fold greater than the 95th percentile application rate of 2.23 lbs/acre, which had some LOC exceedances. Therefore, glyphosate applicators could consider applying lower amounts at a higher frequency to minimize potential acute and chronic risks. Moreover, timing the application of glyphosate to periods when species are less active can result in reduced exposure. Further, establishment of buffer zones around agricultural areas treated with glyphosate can minimize drift into habitats.
It is noteworthy that the results of our study are generally consistent with EPA’s findings and conclusions. As noted by EPA, for major agricultural crops like soybeans, corn, and cotton, the application rates typically range from 0.75 to 2.0 lbs/acre per application; however, in non-agricultural settings (e.g. pastures, forestry), application rates can reach 8 lbs/acre or higher, and these higher application rates have the highest potential for ecological risks25. Our assessment captures a wide range of application rates, but the average and 95th percentile application rates of 0.701 and 2.23 lbs/acre are comparable to the range of applications rates noted for agricultural settings. Our results show that in herpetofauna, birds, and mammals, the RQ exceedances typically occur at the 95th percentile or higher application rates, which generally supports the EPA’s conclusion that glyphosate has low or limited potential risks of concerns in mammals and birds17. As for honeybees, our results show no RQ exceedances of acute simulations and one of the chronic simulations up to the 95th percentile application rate, whereas in the other chronic simulation, chronic RQ exceedances occur at all application rates used. This is also consistent with EPA’s findings. According to EPA, the likelihood of acute adverse effects to adult bees was considered low at application rates up to 5.7 lbs a.e./acre17. EPA also noted that additional data might be necessary to fully evaluate risks to bees17, which is especially true for the chronic exposure scenario.
Limitations
Although the current study provides some insights into potential risks of glyphosate exposure, it is important to acknowledge limitations. First, reliance on models may lead to oversimplification as models are designed to be more conservative. Bee-REX, T-HERPS, and T-REX are screening-level tools intended for preliminary risk evaluations. However, if preliminary evaluations show no risk, no risk would be anticipated with more complex models.
Second, the availability of toxicological data varied, with a limited number of studies available for honeybees and herpetofauna and more studies available for birds and mammals. Thus, there is a greater certainty for the risk predictions for birds and mammals. Additional studies for honeybees, particularly at larval stage, could be beneficial to better understand the potential risks. Additional studies for herpetofauna could also be beneficial. In some avian studies, non-definitive toxicity thresholds were reported (e.g. bobwhite quail LD50 >2000 mg/kg); use of non-definitive toxicity thresholds overestimates risk. For all species examined, additional acute studies on sub-lethal effects could enhance understanding of risk implications. Lastly, conducting field studies to validate laboratory studies and model predictions could be beneficial.
Third, proprietary ingredients are typically used in herbicides containing glyphosate as an active ingredient. Although the study focused on glyphosate, the same methodology could be applied to the proprietary ingredients. Notably, synergistic effects of herbicide ingredients might be possible. Therefore, in addition to considering individual ingredients, it would also be important to estimate mixture toxicity. The acute toxicity estimate of the mixture (ATEmix) approach developed by Hamm et al.26 and noted in Regulation 3.1.3 by the United Nations Globally Harmonized System (GHS) of Classification, Labelling and Packaging (CLP), could be used to evaluate mixture toxicity.
Lastly, the study focuses on California-specific data on glyphosate usage, which may differ from other states. Consequently, the conclusions of this assessment may not be applicable to glyphosate usage in other states or countries. However, the methodology described herein can be applied to usage data from other locations.
CONCLUSIONS
This study demonstrates how the available tools could be potentially used by toxicologists, pesticide manufacturers, and stakeholders during product development to determine the adequate application rates to minimize the likelihood of adverse effects in non-targeted species. It was demonstrated that honeybees had the highest likelihood of risk, whereas the risks were lower for herpetofauna, birds, and mammals. Several risk mitigation strategies were proposed and included conducting species surveys, avoiding glyphosate application when flowering plants are present, and applying glyphosate at lower rates and higher frequency. Overall, the available tools could help inform pesticide development and reduce the need for time-consuming and costly testing.