INTRODUCTION
The availability of potable drinking water is paramount to life forms, especially humans1. Every human activity and physiological function requires good quality water. It helps to normalize the body temperature, eliminate toxic substances from the body, sustain the usual quantity and consistency of bodily fluids, and is fundamental in maintaining the normal arrangement and operation of the skin2.
Regrettably, water in potable form is not always available to the common man in society. Consequently, people resort to alternative sources of water with questionable quality for sustenance1.
Access to quality water influences societal health, productivity, education, and the environment. It reduces the chances of developing diseases, as such development is ensured. Where this is lacking, diseases, mortality rates, and underdevelopment, to mention but a few, will be on the rise; this is typical of developing countries3.
The entire 5 Local Government Areas (LGAs) that constitute the Adamawa North senatorial zone are not provided with pipe-borne potable water. As such, the people of this region entirely depend upon alternative sources of water such as boreholes and hand-dug wells, in addition to streams or rivers, for domestic activities4. Most disturbing is the fact that data on the physicochemical characteristics of these water sources are lacking.
Studies have shown that prolonged exposure to physicochemical parameter values and heavy metal concentrations above WHO standards in water sources may be associated with different kinds of illnesses5. The objective of this study was therefore to report data on the physicochemical and heavy metal characteristics of water sources in Adamawa North senatorial zone and to examine their appropriateness for human utilization based on water quality benchmarks. This is imperative to ensure that these water sources are devoid of chemical contaminants that may imperil the people within these communities.
METHODS
Study area
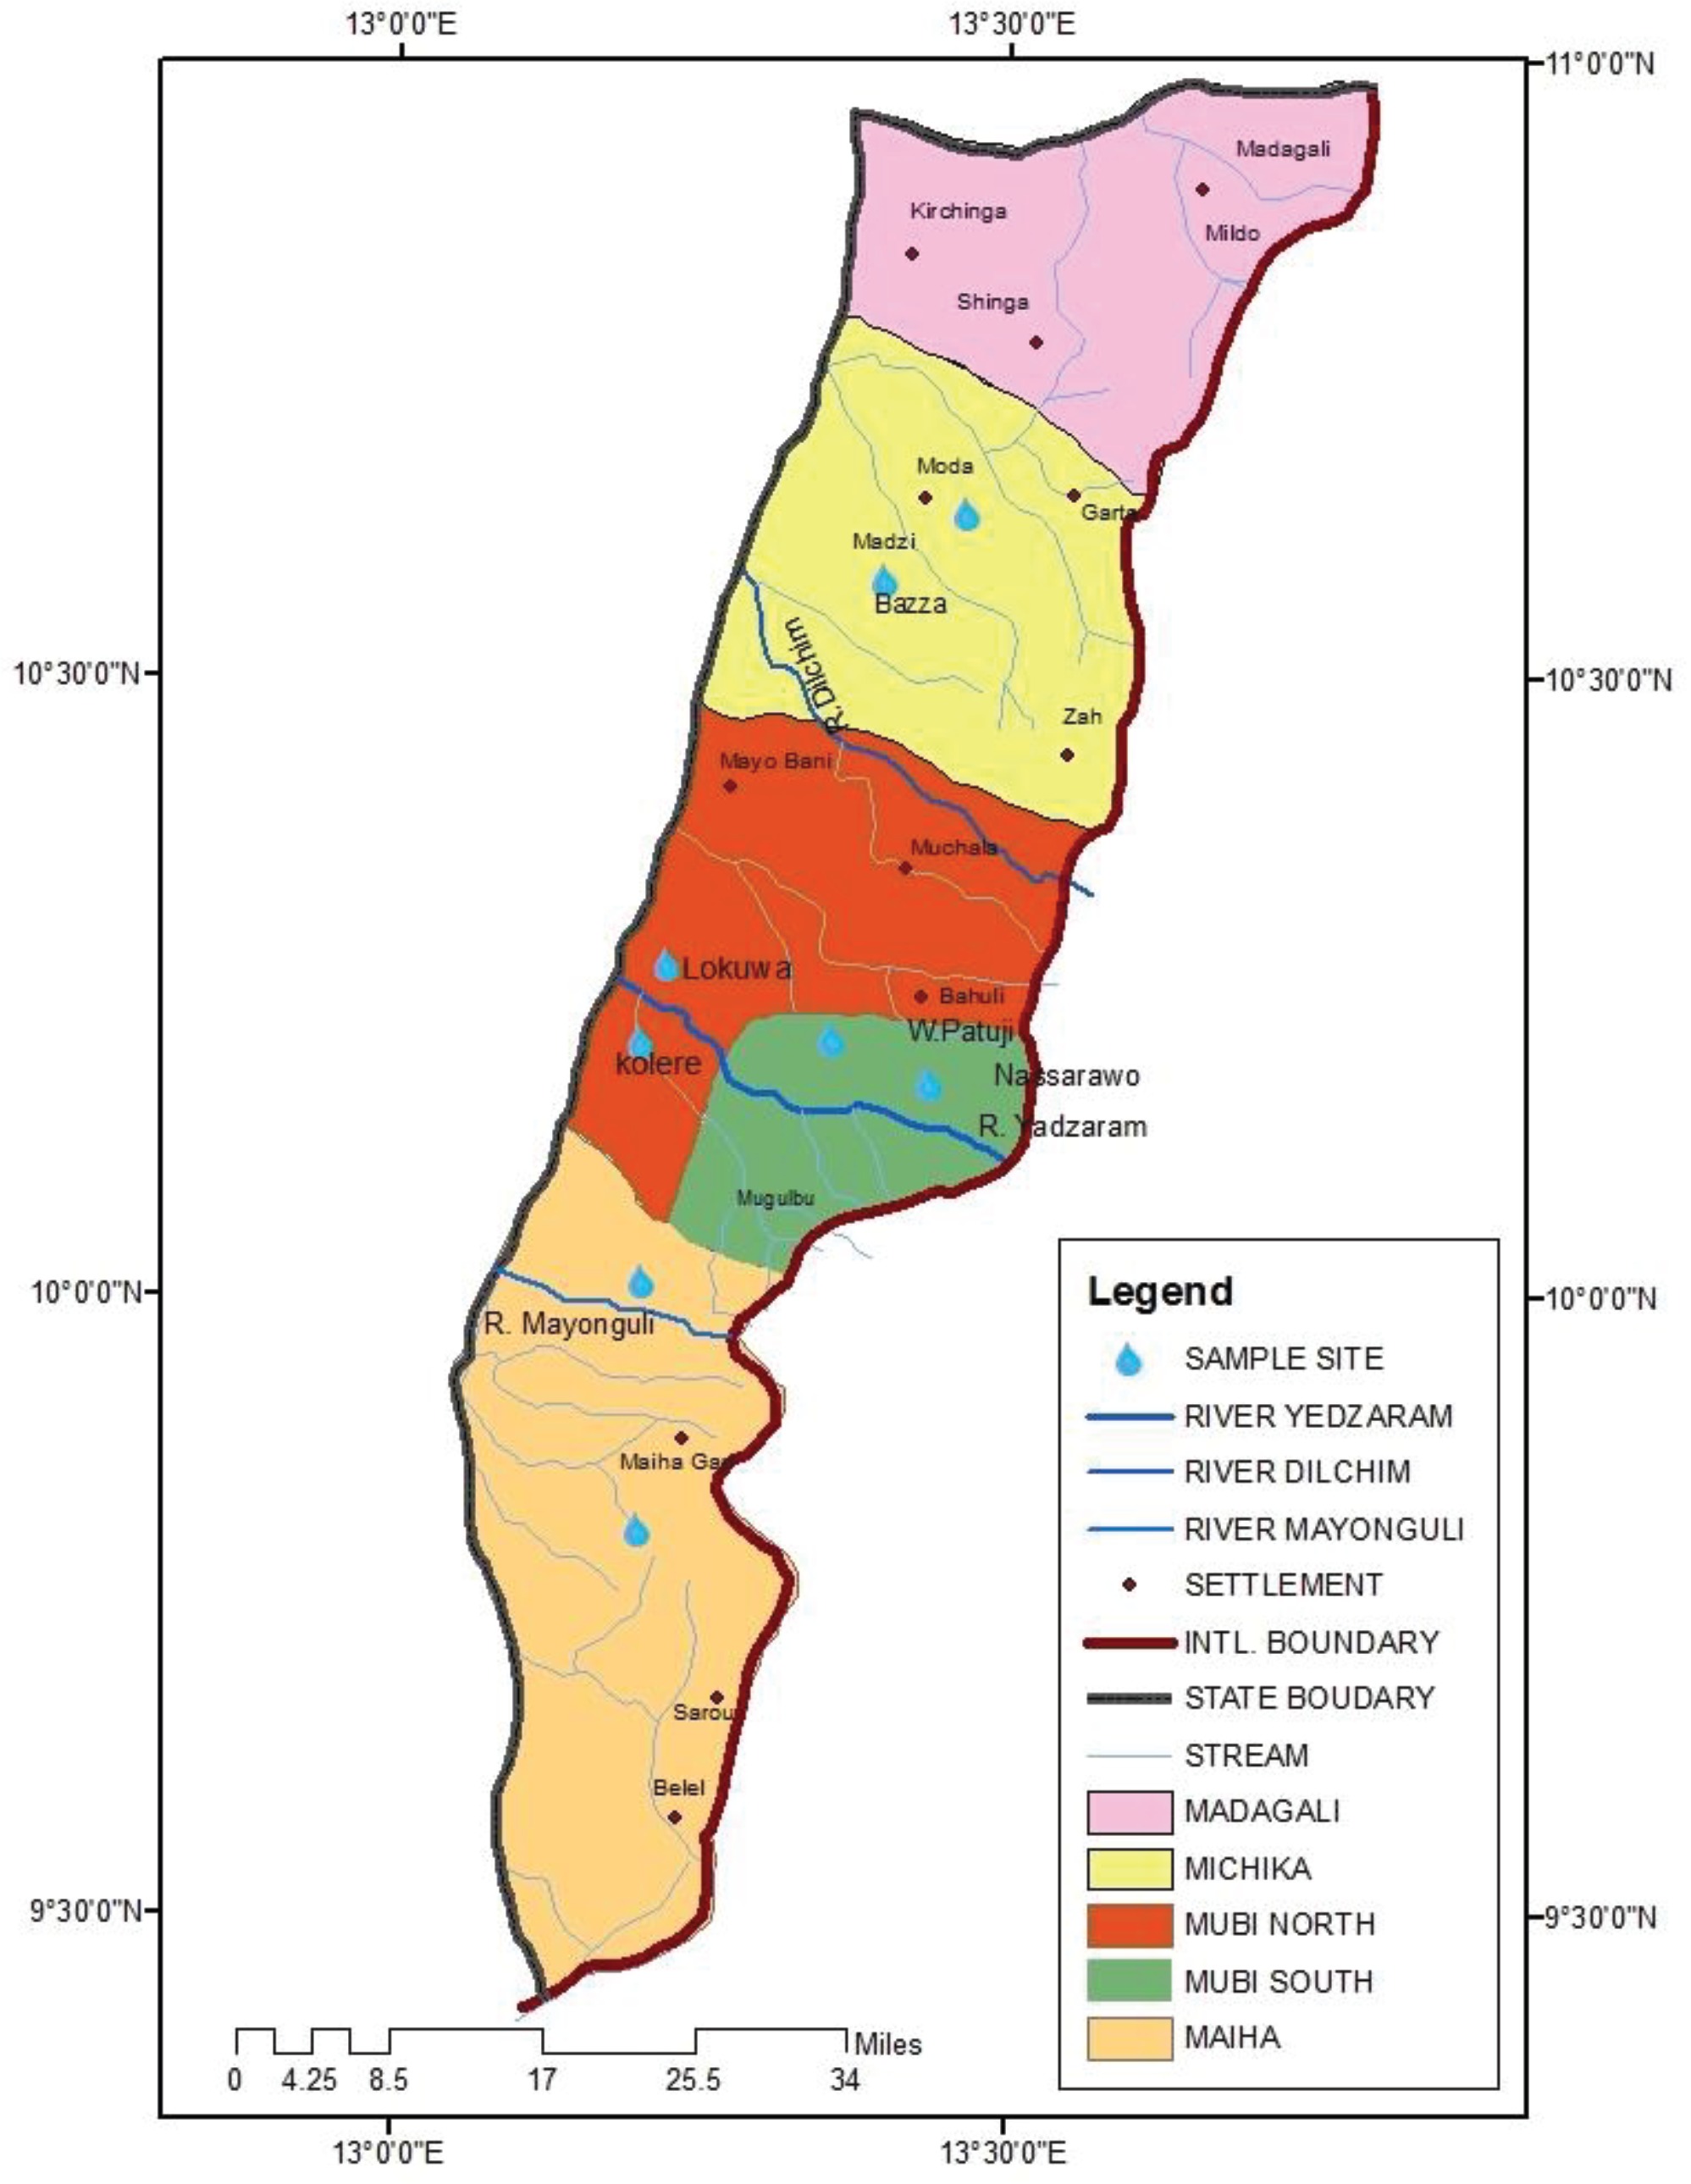
The study area which comprises 5 LGAs (Madagali, Michika, Mubi South, Mubi North, and Maiha) is politically known as Adamawa North senatorial zone or Mubi zone. The area is found within the coordinate’s latitudes 9o 30’ and 11o 00’ N of the equator and between 13o 00’ and 14o 00’ E of the Greenwich meridian (Figure 1). The Adamawa North senatorial zone is characterized by humid rainy and dry seasons4.
Sampling design
Only four LGAs (Michika, Mubi South, Mubi North, and Maiha) were chosen for sample collection; two wards from each LGA. The fifth LGA, Madagali was not accessible at the time of sampling for this study, due to security reasons. From each ward, water from four wells was chosen at random and sampled in duplicate in both dry and rainy seasons. A river/stream was also selected from each LGA for sampling. For each river/stream, a sample was collected at random (upstream and downstream) in duplicate for both dry and rainy seasons.
Sample collection
In all, 128 water samples from 32 hand-dug wells (64 samples for the dry and rainy seasons each) were randomly collected in 500 mL sampling bottles. A total of 32 (16 samples for dry and rainy seasons each) water samples from 4 rivers were collected in 500 mL sampling bottles. All the samples were arranged in a cold jacket and transported to the laboratory for analysis.
Analyses of water for physicochemical parameters
The collected water samples were taken to the Chemistry Department of Adamawa State University and the Chemistry Department of Gombe State University for some physicochemical analyses of rainy and dry season water samples, respectively. The physicochemical parameters considered include: temperature, pH, biological oxygen demand (BOD5), chemical oxygen demand (COD), dissolved oxygen (DO), total dissolved solids (TDS), total suspended solids (TSS), cadmium, total hardness, nitrate, and electrical conductivity.
Temperature, pH, and electrical conductivity were determined by a thermometer, pH meter, and electrical conductivity meter, respectively, at the site of sample collection. Total dissolved solids and dissolved oxygen were measured by Hanna Instrument. Iron and cadmium were measured by atomic absorption spectrophotometer (AAS), while other parameters were determined by gravimetric and titrimetric methods6.
Statistical analysis
For each replicate sample, the mean and standard error of the mean of each physicochemical parameter were calculated. Of these, the non-parametric Mann-Whitney test, Duncan multiple range test (DMRT), and least significance difference (LSD) were used to analyze the data. All data were analyzed using SPSS Statistics for Windows, Version 17.0. (Chicago; Inc.). Data were considered statistically significant when p<0.05.
RESULTS
Physicochemical parameters
The values of the physicochemical parameters of the water samples from 32 hand-dug wells and four rivers sampled in the study area during the study period are shown in Tables 1–4, while Table 5 shows the percentages of water samples with physicochemical values within the acceptable limits. The values of the water quality parameters observed during this study were compared with World Health Organization7 acceptable limits for drinking water quality.
Table 1
Physicochemical characteristics of water from Yedzaram River from Mubi North and Mubi South
| Parameter | Yedzaram River Mubi South | Yedzaram River Mubi North | |||||||
|---|---|---|---|---|---|---|---|---|---|
| WHO7 Limit | Rainy season | Dry season | Rainy season | Dry season | |||||
| Upstream | Downstream | Upstream | Downstream | Upstream | Downstream | Upstream | Downstream | ||
| T (°C) | 23–40 | 19.5 ± 0.85a | 20.6 ± 0.9a | 23.77 ± 0.92b | 23.47 ± 1.24b | 20.8 ± 0.2a | 19.2 ± 0.3a | 25.73 ± 1.84a | 25.30 ± 0.53a |
| pH | 6.5–8.5 | 9.2 ± 0.4a | 8.7 ± 0.4a | 9.73 ± 0.12a | 9.57 ± 0.12a | 8.6 ± 0.1a | 8.5 ± 0.4a | 10.20 ± 0.06a | 9.93 ± 0.07a |
| EC (μS/cm) | 1000 | 202.83 ± 10.9a | 203.93 ± 12.63a | 14.99 ± 1.02b | 17.47 ± 0.8a | 188.80 ± 5.8a | 264.87 ± 58.1a | 2.08 ± 0.07c | 2.18 ± 0.02c |
| DO (mg/L) | 5.0–7.0 | 4.67 ± 0.07a | 4.39 ± 0.25a | 4.41 ± 0.08a | 3.50 ± 0.66a | 5.32 ± 0.25a | 4.09 ± 0.71a | 3.88 ± 0.49a | 3.25 ± 0.92a |
| BOD (mg/L) | 2.0–5.0 | 2.28 ± 0.07a | 1.44 ± 0.42b | 1.54 ± 0.06b | 1.50 ± 0.08b | 1.73 ± 0.22a | 1.80 ± 0.30a | 1.52 ± 0.18b | 1.23 ± 0.12c |
| COD (mg/L) | 10 | 95.97 ± 15.66b | 99.23 ± 0.93b | 113.77 ± 4.32a | 109.87 ± 6.52a | 118.74 ± 1.58a | 86.85 ± 4.33c | 127.07 ± 4.02a | 88.13 ± 9.84c |
| TDS (mg/L) | 500 | 103.40 ± 4.13a | 101.97 ± 6.52a | 85.0 ± 4.0 a | 83.5 ± 1.5 a | 234.0 ± 89.0b | 131.90 ± 29.06a | 95.13 ± 2.49a | 96.0 ± 2.0 a |
| TSS (mg/L) | 35 | 117.5 ± 2.5b | 138.5 ± 2.5b | 143.00 ± 5.59a | 152.40 ± 20.37a | 273.0 ± 83.0a | 120.0 ± 1.0b | 129.47 ± 3.91a | 177.93 ± 30.04a |
| SO4 (mg/L) | 100 | 7.02 ± 0.69a | 6.79 ± 0.49a | 8.18 ± 0.41a | 8.16 ± 0.58a | 7.89 ± 0.35a | 7.76 ± 0.84a | 9.44 ± 0.43a | 8.76 ± 0.15a |
| NO3 (mg/L) | 25–50 | 19.56 ± 4.19a | 24.65 ± 5.93a | 16.42 ± 0.84a | 13.37 ± 0.45b | 22.89 ± 2.28a | 20.1 ± 1.93a | 15.77 ± 0.59a | 14.84 ± 1.39a |
| TH (mg/L) | 150 | 48.0 ± 8.0b | 80.0 ± 40.0b | 31.33 ± 0.67b | 26.00 ± 8.08b | 28.0 ± 4.0b | 36.0 ± 12.0b | 42.33 ± 10.84a | 24.67 ± 8.33b |
| Fe (mg/L) | 0.3 | 2.31 ± 0.03a | 3.63 ± 1.28a | 5.42 ± 0.39a | 4.05 ± 1.11a | 2.26 ± 0.03a | 2.23 ± 0.03a | 3.52 ± 1.45a | 14.88 ± 9.79a |
| Cd (mg/L) | 0.003 | ND | ND | ND | ND | ND | ND | ND | ND |
[i] T: temperature. ND: not detected. WHO: World Health Organization. Values represent the mean and standard error of mean. Values with the same superscripts from each parameter and season are not significantly different (p>0.05) but those with different superscripts are significantly different (p<0.05).
Table 2
Physicochemical characteristics of water from Dilchim River (Michika LGA) and Mayonguli River (Maiha LGA)
| Parameter | Hand-dug well water (Mubi North LGA) | Hand-dug well water (Mubi South LGA) | |||||||
|---|---|---|---|---|---|---|---|---|---|
| WHO7 Limit | Rainy season | Dry season | Rainy season | Dry season | |||||
| Upstream | Downstream | Upstream | Downstream | Upstream | Downstream | Upstream | Downstream | ||
| T (°C) | 23–40 | 19.7 ± 1.1a | 19.9 ± 0.85a | 22.20 ± 1.01b | 21.60 ± 1.93b | 20.8 ± 1.8a | 19.9 ± 1.7a | 20.47 ± 0.69c | 22.13 ± 1.45b |
| pH | 6.5–8.5 | 8.0 ± 0.1a | 8.7 ± 0.6a | 9.33 ± 0.20b | 9.60 ± 0.21a | 8.4 ± 0.4a | 8.1 ± 0.1a | 9.30 ± 0.21b | 9.27 ± 0.41b |
| EC (μS/cm) | 1000 | 194.07 ± 7.01a | 186.03 ± 3.55b | 14.72 ± 0.89b | 15.08 ± 0.61b | 214.13 ± 22.39a | 199.03 ± 3.98a | 14.27 ± 0.03b | 17.49 ± 0.67a |
| DO (mg/L) | 5.0–7.0 | 4.78 ± 0.09a | 4.31 ± 0.34a | 3.65 ± 0.62a | 3.20 ± 0.55a | 4.59 ± 0.13a | 3.66 ± 0.95b | 4.24 ± 0.17a | 4.08 ± 0.52a |
| BOD (mg/L) | 2.0–5.0 | 1.82 ± 0.29a | 1.55 ± 0.47b | 1.64 ± 0.05a | 1.52 ± 0.15b | 2.10 ± 0.05a | 2.18 ± 0.28a | 1.67 ± 0.07a | 1.37 ± 0.11b |
| COD (mg/L) | 10 | 101.17 ± 10.96b | 110.62 ± 6.45b | 122.75 ± 4.37a | 113.08 ± 10.79a | 95.29 ± 10.86b | 119.05 ± 2.44a | 119.67 ± 8.80a | 99.82 ± 8.92b |
| TDS (mg/L) | 500 | 98.07 ± 2.39a | 92.93 ± 1.75a | 84.0 ± 1.0 a | 65.5 ± 0.5 a | 105.43 ± 12.10a | 99.37 ± 2.19a | 72.5 ± 9.5 a | 81.0 ± 6.0 a |
| TSS (mg/L) | 35 | 126.5 ± 10.5b | 132.5 ± 14.5b | 121.50 ± 2.97a | 119.67 ± 4.94a | 124.5 ± 6.5b | 129.5 ± 10.5b | 171.03 ± 50.04a | 136.00 ± 11.03a |
| SO4 (mg/L) | 100 | 7.08 ± 1.03a | 7.09 ± 1.07a | 7.49 ± 1.06b | 7.07 ± 3.03b | 6.25 ± 0.13a | 6.73 ± 0.45a | 6.47 ± 0.21c | 7.58 ± 0.33b |
| NO3 (mg/L) | 25–50 | 28.72 ± 0.62a | 22.2 ± 3.09a | 14.22 ± 1.42a | 12.60 ± 0.52c | 20.15 ± 0.42a | 20.24 ± 0.61a | 12.35 ± 0.37c | 11.71 ± 0.15d |
| TH (mg/L) | 150 | 32.0 ± 8.0b | 72.0 ± 8.0b | 29.17 ± 2.59b | 26.67 ± 2.67b | 60.0 ± 4.0b | 175.0 ± 25.0a | 21.20 ± 5.40b | 26.67 ± 2.67b |
| Fe (mg/L) | 0.3 | 2.47 ± 0.02a | 2.57 ± 0.04a | 4.96 ± 2.49a | 3.72 ± 1.30a | 2.33 ± 0.08a | 2.31 ± 0.19a | 6.43 ± 3.39a | 2.05 ± 0.17a |
| Cd (mg/L) | 0.003 | ND | ND | ND | ND | ND | ND | ND | ND |
[i] LGA: local government area. T: temperature. ND: not detected. WHO: World Health Organization. Values represent the mean and standard error of mean. Values with the same superscripts from each parameter and season are not significantly different (p>0.05) but those with different superscripts are significantly different (p<0.05).
Table 3
Physicochemical characteristics of well water in Mubi North and Mubi South LGAs
| Parameter | Hand-dug well water (Mubi North LGA) | Hand-dug well water (Mubi South LGA) | |||||||
|---|---|---|---|---|---|---|---|---|---|
| WHO7 Limit | Rainy season | Dry season | Rainy season | Dry season | |||||
| A | B | A | B | C | D | C | D | ||
| T (°C) | 23–40 | 20.6 ± 2.83a | 19.75 ± 0.75a | 22.63 ± 2.20a | 25.57 ± 1.35a | 20.45 ± 0.75a | 20.75 ± 0.95a | 24.80 ± 1.44a | 22.63 ± 1.67a |
| pH | 6.5–8.5 | 9.90 ± 0.40a | 9.10 ± 0.50b | 10.77 ± 0.09a | 10.80 ± 0.12a | 10.15 ± 0.05a | 9.0 ± 0.30b | 10.80 ± 0.06a | 10.87 ± 0.20a |
| EC (μS/cm) | 1000 | 2009.3 ± 290.9c | 2274.3 ± 112b | 22.85 ± 0.05a | 25.32 ± 5.58a | 2392.3 ± 216.a | 2861.7 ± 63.7a | 22.40 ± 0.20a | 18.8 ± 15.6a |
| DO (mg/L) | 5.0–7.0 | 4.00 ± 0.74a | 4.40 ± 0.29a | 3.89 ± 0.29a | 3.07 ± 0.29 a | 3.59 ± 0.09a | 4.48 ± 0.11a | 3.75 ± 0.38 a | 3.00 ± 0.77 a |
| BOD (mg/L) | 2.0–5.0 | 1.49 ± 0.16b | 1.34 ± 0.22b | 1.54 ± 0.18a | 1.44 ± 0.06a | 1.57 ± 0.44b | 1.11 ± 0.10c | 1.34 ± 0.05a | 1.59 ± 0.07a |
| COD (mg/L) | 10 | 113.34 ± 16.78a | 84.33 ± 0.92a | 113.29 ± 14.28a | 105.41 ± 5.58a | 92.2 ± 7.97a | 86.8 ± 6.89a | 96.95 ± 4.37a | 117.95 ± 4.89a |
| TDS (mg/L) | 500 | 1005.0 ± 147.0a | 1137.7 ± 56.4a | 979.0 ± 4.0a | 1261.5 ± 411.5a | 1198.3 ± 106.8a | 1430.3 ± 31.3b | 923.5 ± 18.5a | 1448.5 ± 93.5a |
| TSS (mg/L) | 35 | 97.5 ± 2.5b | 95.5 ± 19.5b | 26.93 ± 5.09a | 33.60 ± 2.66a | 68.0 ± 7.0c | 105.0 ± 3.0a | 31.50 ± 3.36a | 42.07 ± 0.73b |
| SO4 (mg/L) | 100 | 7.01 ± 0.69a | 6.66 ± 0.51b | 7.41 ± 0.63a | 7.18 ± 0.19a | 6.91 ± 0.02a | 6.01 ± 0.28b | 7.01 ± 0.37a | 7.17 ± 0.26a |
| NO3 (mg/L) | 25–50 | 22.49 ± 0.34b | 31.13 ± 0.98a | 16.16 ± 0.70b | 17.57 ± 0.88a | 26.41 ± 2.26b | 21.95 ± 0.93c | 16.34 ± 0.25b | 16.64 ± 0.21a |
| TH (mg/L) | 150 | 492.0 ± 28.0b | 540.0 ± 100.0b | 80.40 ± 8.24c | 82.97 ± 6.49b | 404.0 ± 20.0c | 592.0 ± 8.0b | 84.00 ± 6.93b | 111.03 ± 19.49a |
| Fe (mg/L) | 0.3 | 0.72 ± 0.12a | 0.66 ± 0.02a | ND | ND | 0.72 ± 0.07a | 0.72 ± 0.17a | ND | ND |
| Cd (mg/L) | 0.003 | ND | ND | ND | ND | ND | ND | ND | ND |
[i] LGA: local government area. T: temperature. ND: not detected. WHO: World Health Organization. Values represent the mean and standard error of mean. Values with the same superscripts from each parameter and season are not significantly different (p>0.05) but those with different superscripts are significantly different (p<0.05).
Table 4
Physicochemical characteristics of well water from Michika and Maiha LGAs
| Parameter | Hand-dug well water (Michika LGA) | Hand-dug well water (Maiha LGA) | |||||||
|---|---|---|---|---|---|---|---|---|---|
| WHO7 Limit | Rainy season | Dry season | Rainy season | Dry season | |||||
| E | F | E | F | G | H | G | H | ||
| T (°C) | 23–40 | 19.80 ± 0.30a | 20.50 ± 1.70a | 24.80 ± 0.79a | 26.13 ± 0.85a | 21.25 ± 1.75a | 19.25 ± 1.25a | 26.57 ± 1.07a | 24.93 ± 1.48a |
| pH | 6.5–8.5 | 8.90 ± 0.40b | 9.0 ± 0.60b | 10.77 ± 0.09a | 10.47 ± 0.20a | 8.85 ± 0.55b | 8.40 ± 0.30c | 10.67 ± 0.18a | 10.63 ± 0.18a |
| EC (μS/cm) | 1000 | 2646.3 ± 181.4a | 2021.0 ± 37.0c | 30.25 ± 0.95a | 27.35 ± 3.75a | 2286.3 ± 37.9b | 2365.3 ± 35.2b | 23.05 ± 2.05a | 24.69 ± 1.11a |
| DO (mg/L) | 5.0–7.0 | 4.15 ± 0.60a | 4.06 ± 0.31a | 3.79 ± 0.39 a | 2.96 ± 0.66 a | 4.07 ± 0.51a | 4.35 ± 0.37a | 3.59 ± 0.41 a | 3.28 ± 0.29a |
| BOD (mg/L) | 2.0–5.0 | 1.98 ± 0.03a | 1.28 ± 0.02c | 1.55 ± 0.15a | 1.53 ± 0.12a | 1.59 ± 0.04b | 1.12 ± 0.09c | 1.58 ± 0.07a | 1.51 ± 0.03a |
| COD (mg/L) | 10 | 106.07 ± 7.39a | 92.74 ± 4.58a | 113.36 ± 11.34a | 112.41 ± 9.63a | 78.70 ± 22.4a | 104.35 ± 1.25a | 116.11 ± 6.94a | 110.85 ± 2.67a |
| TDS (mg/L) | 500 | 1338.7 ± 105.7b | 1011.3 ± 18.4a | 1328.5 ± 16.5a | 1283.5 ± 278.5a | 1142.7 ± 18.5a | 1187.7 ± 14.4a | 944.0 ± 98.0a | 1147.0 ± 11.0a |
| TSS (mg/L) | 35 | 107.0 ± 3.0a | 103.5 ± 6.5a | 38.70 ± 4.42b | 31.93 ± 2.79a | 83.5 ± 1.5b | 110.0 ± 9.0a | 33.23 ± 1.28a | 32.30 ± 0.98a |
| SO4 (mg/L) | 100 | 6.14 ± 0.04b | 6.59 ± 0.47b | 6.84 ± 0.21a | 6.19 ± 0.30a | 5.68 ± 0.47b | 5.43 ± 0.36c | 6.14 ± 0.66a | 9.92 ± 4.11a |
| NO3 (mg/L) | 25–50 | 25.94 ± 6.23b | 22.62 ± 0.88b | 17.28 ± 0.74a | 16.06 ± 0.19b | 22.08 ± 2.12b | 22.56 ± 0.83b | 18.57 ± 0.68a | 18.58 ± 0.49a |
| TH (mg/L) | 150 | 752.0 ± 8.0a | 680.0 ± 200.0b | 98.67 ± 1.33b | 87.10 ± 0.59b | 452.0 ± 52.0c | 523.0 ± 13.0b | 95.33 ± 4.37b | 84.00 ± 5.03b |
| Fe (mg/L) | 0.3 | 0.67 ± 0.07a | 0.77 ± 0.02a | ND | ND | 0.41 ± 0.24a | 0.58 ± 0.05a | ND | ND |
| Cd (mg/L) | 0.003 | ND | ND | ND | ND | ND | ND | ND | ND |
[i] LGA: local government area. T: temperature. ND: not detected. WHO: World Health Organization. E: Michika. F: Bazza. G: Maiha. H: Pakka. Values represent the mean and standard error of mean. Values with the same superscripts from each parameter and season are not significantly different (p>0.05) but those with different superscripts are significantly different (p<0.05).
Table 5
Percentages of water samples with physicochemical quality within acceptable limits
The mean maximum temperature value (26.57 ± 1.07 °C) was recorded in the well-water sample during the dry season in Maiha, while the minimum (19.2 ± 0.3 °C) was recorded during the rainy season downstream of Yedzaram River (Mubi-North). Temperature variation was not statistically different (p=0.087) for well-water samples in all the locations, while temperature variation was statistically higher during the dry season upstream and downstream of Yadzaram River (Mubi-North) (p=0.305) than the other river-water samples in other locations (p=0.010). The maximum pH mean concentration (10.87 ± 0.20) was documented in a well-water sample from Nassarawo during the dry season, while the least pH mean concentration (8.0 ± 0.1) was recorded during the rainy season upstream of Dilchim River in Bazza (Michika LGA). The maximum (2861.7 ± 63.7 μS/cm) and least (2.08 ± 0.07 μS/cm) EC mean concentration values were documented in well water during the rainy season in Nassarawo and upstream of Yadzaram River (Mubi North) during the dry season, respectively. The EC of well water (p=0.000) and river water (p=0.012) in the rainy season was significantly higher than was sampled during the dry season. The maximum (2.28 ± 0.07 mg/L) BOD mean value was recorded in rainy season upstream of Yedzaram River (Mubi South), while the minimum (1.11 ± 0.10 mg/L) was documented in Nassarawo during the rainy season. Although the BOD of all the water samples was higher in the rainy season, it was relatively not different (p=0.242) from that of the dry season. The highest (127.07 ± 4.02 mg/L) and the least (86.85 ± 4.33 mg/L) COD mean values were recorded upstream and downstream of Yedzaram River (Mubi North) during the dry and rainy seasons, respectively. The mean COD of river-water samples was higher than that of the well-water samples but with no statistical difference (p=0.290). The COD values for water from hand-dug wells sources were found to be similar (p=0.791) in all the locations in both dry and rainy seasons. The highest TDS mean value (1448.5 ± 93.5 mg/L) was recorded in hand-dug well-water sources during the dry season in Wuropatuji, while the least (65.5 ± 0.5 mg/L) was documented upstream of Yedzaram River (Mubi North) during the dry season. The TDS values of hand-dug well-water sources were statistically higher than those of river-water sources (p=0.024). The TSS mean value was highest (273.0 ± 83.0 mg/L) during the rainy season upstream of Yedzaram River (Mubi North), and lowest (26.93 ± 5.09 mg/L) in hand-dug well-water sources in Lokuwa during the dry season. The sulphate mean concentration was peak (9.92 ± 4.11 mg/L) during the dry season in hand-dug well-water sources in Pakka, and lowest (6.25 ± 0.13 mg/L) upstream of Mayonguli River during the rainy season. Also, the mean sulphate content of river-water samples was higher substantially when compared with well-water samples (p=0.040). The nitrate mean value (31.13 ± 0.98 mg/L) was highest in hand-dug well-water sources during the rainy season in Kolere, and the least value (11.71 ± 0.15 mg/L) was recorded during the dry season downstream of Mayonguli River. The TH mean concentration was highest (752.00 ± 8.0 mg/L) in hand-dug well-water sources in Michika during the rainy season, and the least value (24.67 ± 8.33 mg/L) was recorded in the dry season downstream of the Yadzaram River (Mubi North). The TH of water from the hand-dug well sources was notably higher (p=0.001) than that of river water sampled. Also, the TH of water sources sampled was significantly higher in the rainy season (p=0.012) when compared to the dry season.
Heavy metal concentrations
In this study, the heavy metals screened were iron and cadmium. The values of the heavy metal concentrations of water samples from 32 hand-dug wells and four rivers sampled in the study area during the study period are shown in Tables 1–4, while Table 5 shows the percentages of water samples with heavy metals concentrations within the acceptable limits. The values of the heavy metals observed during this study were compared with World Health Organization7 acceptable limits for drinking water quality.
The least iron concentration (0.41 ± 0.24 mg/L) in the water sources was recorded from hand-dug well-water sources in Pakka during the rainy season, while the maximum mean concentration (14.88 ± 9.79 mg/L) was recorded downstream of Yedzaram River during the dry season. Iron was not detected in water from hand-dug wells during the dry season. In the rainy season, however, iron was detected in all the sampled hand-dug well-waters but with no substantial variance (p=0.8107) in all the locations. The mean iron concentration of water from all the sources was higher in the dry season but with no substantial difference (p=0.732) from that of the rainy season. Cadmium was not detected in both river and hand dug well-water sources of all the locations in both the dry and rainy seasons.
DISCUSSION
Temperature constitutes an important physicochemical variable that is often used to evaluate the quality of water used for human consumption8. All the chemical and biological processes in a living organism, including increases in color and taste of water, and alkalinity, acidity, pH and dissolved oxygen of water, are regulated by temperature8,9. The temperature range of river water (20.47–25.73 °C and 19.3–20.8 °C) and well water (22.63–26.57 °C and 19.25–21.25 °C) for both dry and rainy seasons documented in this study were lower than the temperature range reported in some river-water samples in Malaysia10, Abeokuta, Ogun State9 and sampled hand-dug well water in some states of Nigeria7,11. This variation could be due to differences in geographical location. The range of temperature in samples from both river and hand-dug wells in all locations was within the range of WHO acceptable limits for the temperature of drinking water. This corroborates the result of previous studies in Maiduguri, Borno State12, and Kwara State11. Nonetheless, a previous study13 recorded temperature values above WHO standards. According to that study, a higher temperature beyond the WHO acceptable limit does not imply impurities14, but could adversely impede the dissolution of oxygen, accelerate chemical reactions, and cause thermal pollution. These might adversely affect aquatic life, increase metabolic activities of microorganisms and intensify taste and odor due to anaerobic reaction, which consequently will render the water unacceptable for domestic use13.
The pH is a measure of hydrogen (H+) ions and negative hydroxide (OH-) ions in water, and indicates whether the water is acidic or alkaline15. The range of pH for both river- and well-water samples was high in both seasons and was found to be alkaline. This corroborates previous studies in India16 and Nigeria17. High alkaline pH values of water bodies, as seen in this study, usually affect the activities of biological systems and could give an objectionable taste to water samples as previously reported18. More so, studies have shown that high and low pH can be destructive10. The alkaline pH value of the entire water sources examined in this study might be due to the presence of alkaline earth metals (e.g. sodium) which, when they interact with soluble carbon dioxide, form carbonates and bicarbonates which increase the pH of the water samples beyond 7. Other elements such as phosphorus, potassium, boron, and nitrogen-containing compounds were reported to contribute to the alkalinity of water17. The pH of all the water sources examined, was above WHO acceptable limits, except upstream of river Dilchim River and Mayonguli River, and downstream of Yedzaram River (Mubi North) and Mayonguli River in the rainy season, as well as sampled hand-dug well water in Pakka during the rainy season. This corroborates a previous report in Southwestern Nigeria19. However, the observations of this study were in contrast to previous studies10,20 which showed that the pH of their water samples was within the WHO acceptable limit. The maximum and minimum pH values of the samples of both river/stream and hand-dug well water, were recorded during the dry and rainy seasons, respectively. This was in agreement with the findings of previous studies10,20. According to these, maximum pH in the dry season may be due to water levels and nutrient concentrations, and minimum pH in the rainy season could be due to the dilution of the water bodies as a result of rainfall.
The ability of natural waters to allow the flow of electrical current through them is known as electrical conductivity (EC). This property largely relies upon the occurrence of salts, their kinetics, valence total or relative concentration, and temperature21,22. In this study, the EC range of river-water samples in both the rainy and dry seasons and the EC of water from hand-dug well sources in the dry season, were within the recommended limits of WHO. This corroborates reports from previous studies10,22. This implies that the level of contaminants that contribute to EC in the water sources at the time of sampling, was minimal or negligible. However, the EC of well-water samples in the rainy season was above the WHO recommended limits. This concurs with the reports of previous studies in Nigeria and elsewhere13,22,23. This suggests a significant level of contamination, especially from dissolved ions or salts and soluble minerals from the bedrock, which in turn may render the water sources unfit for domestic use10,22. Furthermore, a higher EC level may not be suitable for agricultural use, especially irrigation. This is because food plants and other plant species are destroyed by disproportionate EC21. Electrical conductivity is also used as a marker of salinity which is an essential component of taste. Taste is an exclusive and vital factor that influences the acceptability and rejection of any water source by the consumer. Hence, high EC may reduce the aesthetic value of the water thereby promoting its rejection by the end-user21.
The mean DO concentrations documented in this study were in agreement with the findings of a previous study in India24, but were higher than the DO values reported in well-water samples in Akwa Ibom State22 and also river-water samples in Sokoto25 and Uruan Akwa Ibom State22. The observed lower level of DO in dry than rainy seasons corroborates the findings of previous studies in Abeokuta19 and Abuja17, Nigeria. The dry season in our study area is characterized by high temperature, low water flow (for surface water), low water volume, and a high rate of human activity around the water bodies. These attributes tend to reduce the rate of aeration, and consequently the amount of DO in water bodies. The DO in water bodies is a valuable parameter because it indicates the position of biological degradation of organic waste by both aerobic and anaerobic organisms26. A high DO level in water bodies indicates that they are healthy and able to support a wide range of aquatic organisms. However, as DO levels fall below 5.0 mg/L, aquatic organisms become stressed. Most aquatic organisms may not persist for a long time at DO levels <3 mg/L26. Thus, the results of this study also show that the majority of the water samples exhibited a DO level below the value recommended by WHO (5–7 mg/L), but greater than 3 mg/L. As a result, the water bodies at these sites will maintain most aquatic organisms.
The range of BOD in all the water samples was within the permitted 2.0 mg/L as stipulated in the guidelines of WHO for drinking water. This observation was comparable to the findings of a previous study27. This suggests a low level of organic matter and so the water sources can support aquatic life. In contrast, a previous study25 reported a range of BOD in both dry and rainy seasons that was relatively low when compared with those of this study and also below the WHO standard. This type of water may adversely affect aquatic life which cannot tolerate a low level of oxygen25. BOD levels higher than those in this study and above the WHO recommended standard, were reported in both surface and groundwater sources7,17.
The COD value is often employed to estimate the amount of contamination caused by organic matter in water28. The range of COD values for both river- and well-water samples in both seasons were above the WHO permissible limits of 10 mg/L for COD values in water samples29. Our study area is an agricultural terrain that most often depends on the use of organic and chemical fertilizers for agricultural practices in both dry and rainy seasons. As such, the washing of these organic matters into water sources in addition to the discharge of municipal waste and sewage could be the reason for the high level of COD observed in this study. Also, high COD values beyond WHO permissible limits but lower than those in this study have been observed for Elala river-water20 and well-water samples in other parts of Nigeria7,11. The higher level of COD in river-water sources as reported in this study is not unexpected. This is because the river sources are more vulnerable to sources of contamination by organic matter due to their large surface area. However, the lack of statistical difference in the mean COD values between the two sources of water (rivers and wells), points to the fact that both sources of water are exposed to similar or the same sources of contamination. Moreover, the higher level of COD in well-water samples as seen in this study, may be attributed to accumulated organic matter arising either from anthropogenic or natural sources, which is not easily washed off or diluted due to the enclosed nature or low surface area of hand-dug wells. Significant variations in COD values for river-water samples were observed in some sampling locations in both seasons. This observation concurs with the reports of previous studies20,26. This reflects sources of different levels of organic matter in these areas. The higher level of COD in the dry than in the rainy season could be due to the decrease in rainfall, with a resultant increase in the concentration of electrolytes and other elements in the water sources24.
A water sample with a TDS level of <500 mg/L is considered to be of good quality. However, water becomes notably and progressively not suitable for drinking when the TDS value is around 1000 mg/L or above27. The TDS range of river-water samples in this study for both dry and rainy seasons was within the permissible limits given by WHO (500 mg/L). This is comparable to TDS values reported in river-water samples in Ogun State, Nigeria19, FCT, Nigeria17, Malaysia10, and India24. Also, another study in Adamawa State, Nigeria, reported lower TDS values than those in this study (but within WHO permissible limits) from two rivers’ sources30. The level of recorded TDS in river-water samples, though lower than the WHO recommended value, indicates a relatively low level of pollution; as such, the water may be suitable for domestic use probably after slight treatment. Furthermore, the mean TDS values of well water for both seasons in the study area were far beyond the permissible limits prescribed by WHO (500 mg/L). Higher TDS values in well water beyond WHO recommendations were variously reported in Nigeria. These include the mean TDS values of 512.5 mg/L and 690.95 mg/L from 16 and 20 hand-dug wells, respectively, in Bauchi State13,31. Also, high TDS values (3312–7566 mg/L) than those recorded in this study, beyond WHO permissible limits, were also reported in well-water samples of riverine communities in River State32. The high TDS values of well-water samples recorded could be due to rock or soil weathering, and also through leaching and percolation of dissolved ions from pit latrines, septic tanks, domestic waste dumps, and agricultural waste into the hand-dug wells due to their location and sometimes their unprotective nature, as previously observed22,31. It may also be attributed to accumulated dissolved ions that percolated or leached into the wells as a result of numerous human or natural phenomena around the water source, which are not easily washed off or diluted due to the enclosed nature or low surface area of the wells. A TDS value above the WHO standard implies that the water is contaminated and may not be suitable for domestic use, may rust containing vessels, and also have an offensive odor or taste7,11. Furthermore, higher TDS can be toxic to aquatic organisms. This is because a high TDS may increase the salinity of the water and also help to alter the constituents of the water sources20.
TSS is defined as substances that are unable to pass through a 45 µm in diameter filter. They range in size from 0.1–10 mm in diameter and are composed of suspended particles, soil, silt particles or fine clay, organic and inorganic compounds, plankton and other organisms that are floating in water bodies17,20. The mean TSS values documented in all river-water samples for both seasons and well-water samples in the rainy season, including most of the well-water samples in the dry season, were high and beyond the recommended limit prescribed by WHO (35 mg/L). This corroborates previous studies which reported higher TSS values beyond WHO permissible limits in both surface20,25 and groundwater sources7,11. Higher TSS values in well-water could be due to the presence of silt or clay in the bedrock of the well-water sources. Higher TSS values in river-water than well-water samples as observed, corroborate previous studies22,30. This may be attributed to easy access of water runoff into river water sources. The higher level of TSS in the rainy than dry season corroborates previous studies10,25. This could be attributed to rainwater runoff, which stimulates soil erosion and which finally ends up in river water or percolates into well water sources. It could also be due to the presence of buoyant substances such as fine silt carried by rainwater25.
The recorded range and mean values of sulphate in both water sources and in both seasons were within the recommended limits of WHO. This indicates that the study area, for now, has an insignificant industrial load as most of the sampling sites are either rural or suburban settlements. As such, based on sulphate concentration, the sampled water sources may be considered of good quality. This corroborates a study from Maiduguri, Borno State, that reported low sulphate concentration in all their water sources12. Similarly, several previous studies also reported low or acceptable limits of sulphate in water from hand-dug wells7,11 and rivers10,17 in their study areas. A high sulphate concentration, exceeding the WHO recommended permissible limit, can have a cathartic effect (i.e. may lead to purging)12. It can also give an undesirable, offensive, or bitter taste, rotten egg smell to water sources, and also increase the corrosive properties of water13.
The recorded range of nitrate in sampled water sources was within the acceptable limits of WHO for all seasons. Previous studies reported similar findings from water sources in their study areas10,11,27. Studies have shown that the occurrence of nitrate above 10 mg/L in natural waters, usually suggests man-made pollution. As such, the mean range of nitrate recorded reflects man-made pollution of both water sources. Nitrate in water is contributed by livestock waste, fertilizers, septic tanks, urban runoff, and wastewater discharges17. However, a previous study reported a high level of nitrate beyond the WHO recommended value (50 mg/L)14. Elevated nitrate concentrations in sources of water have been reported to have harmful effects on infants and sometimes pregnant mothers11,22. The toxicity of nitrate evolves when nitrate is converted to nitrite which occurs naturally in the body. Nitrite forms oxidized iron in hemoglobin to form methemoglobin. This leads to methemoglobinemia or ‘blue baby’ syndrome and cyanosis in infants; a condition in which the oxygen-carrying capacity of the blood is threatened or reduced due to the formation of methemoglobin7. Furthermore, nitrate when converted to nitrite in the human body may combine with secondary amines in the human stomach to form highly carcinogenic N-nitroso compounds31 that are responsible for gastric cancer.
The mean TH values for all the river water sampled in all seasons and hand-dug well water for the dry season were within the range of WHO acceptable limits for drinking water. This corroborates earlier studies on groundwater sources11,22,27 and surface water sources10. This implies that most of the water samples analyzed from the two sources were soft. Also, the recorded higher level of total hardness above the WHO permissible limit for hand-dug well water sampled in the rainy season concurs with earlier studies14,30,31. This may be attributed to the percolation of dissolved calcium and magnesium into the hand-dug wells31. Furthermore, leachate from landfills, septic tanks, and pit toilets may also be contributory factors to the higher level of TH in samples of hand-dug well water. Economically, the use of hard water for domestic purposes may lead to fuel costs and soap wastage or to an increase in soap usage during laundry18. This is because hard water lowers the lathering capacity of soap and so laundering is impaired31.
The documented high level of iron concentration in water samples beyond the WHO recommended value of 0.03 mg/L was consistent with reports of previous studies27,30. This may be because the soil bedrock or the river bank is ferruginous. Contrary to the finding of this study, some earlier studies in Niger33 and Borno States12 reported lower iron concentration levels that were within WHO recommended level. Though iron was reported to be an important element in the human body, its presence in water, however, could also be associated with health risks33. Non-detection of iron in hand-dug well water during the dry season was consistent with the finding of a previous study which reported non-detection of iron in the water sample of their location33, though seasonal variation was not considered in their studies. More so, the detection of iron concentration in hand-dug well water in the rainy season may be due to water run-off from rainfall. A previous study showed that rainwater is vital in increasing the concentration of iron in groundwater sources34. When rainwater infiltrates the soil and other rock formations, iron is dissolved which subsequently percolates into aquifers which serve as sources of groundwater and hand-dug wells35.
Cadmium was not detected in all the water sources of all the locations in both dry and rainy seasons. This was similar to previous studies in hand-dug wells reported in the Hardo ward of Bauchi State31. This could be due to the absence of mining activities in the study area. Contrary to the finding of this study, other studies reported trace21 to moderately high concentrations of cadmium in their various water sources35.
Strengths and limitations
Due to the prior lack of adequate data in the study area, the findings of this study contribute to knowledge on the physicochemical and heavy metal concentrations in the two water sources of the study area, thus providing benchmark data for future reference. The lack of sampling of water sources in Madagali LGA, the fifth LGA that constitutes the Adamawa North senatorial zone, due to security reasons, was a limitation of this study.
CONCLUSIONS
This study has demonstrated that the values of the physical, chemical or heavy metal parameters in the tested water sources were either nil, above or within the limits of WHO guidelines for drinking water. The results further show that most of the locations whose well water or river water was tested, had at least an instance in which a parameter was above the benchmark limits. This, therefore, portrayed the poor quality of the water sources and the health risk it may constitute to the population in the study area utilizing these water sources. We therefore recommend the provision of potable pipe-borne water supplies to the population in the study area.