
INTRODUCTION
Web-based surveys have gained increased popularity in recent years because of their efficiency in time and cost1-6. This increased resource efficiency, however, potentially comes at the price of decreased precision and validity because of inadequate sampling and low response rates7. People are increasingly bombarded with emails; the average American office worker in 2017 received about 120 emails per day, of which only 34% were opened8. A low response rate (or small sample size) does not automatically signal a selection bias problem just as a high response rate (or large sample size) does not automatically guarantee validity (e.g. a large volunteer sample). Yet, the strong potential for bias with web surveys requires careful attention to sampling and non-sampling errors that could threaten their validity7.
Despite their increasing adoption and use, there are relatively few resources for public health practitioners on applied epidemiological considerations when conducting web surveys; much of the existing body of knowledge has been limited to comparisons of indexes of performance (e.g. response rates) across survey modes9-13. This article presents an overview of web survey design and implementation. Six practice-oriented items are critically examined: 1) The study question; 2) The target population; 3) Study population needed; 4) Sampling or selecting the participants in a representative manner; 5) Sending the survey invitations in a manner that is efficient, safe, and mitigates bias; and 6) Assessing and enhancing the external validity of collected data. For each of these items, a broad overview of principles, rather than specifics, is provided to prepare public health 2practitioners to become better acquainted with the design and implementation of web surveys.
This study assumes a list-based, probability web survey where a sampling frame is constructed from an existing directory/register, or other source, with contact information abstracted and used to contact participants. However, several of these principles may also apply to other web survey modes, e.g. pre-recruited panels of internet users. Sample size calculations are assumed to be based on statistical precision of estimates, rather than on the basis of cost.
METHODOLOGICAL APPROACH
The study question
Properly articulating the research question can help with critical decision making, including determining whether the question posed can be answered with a cross-sectional design, or whether there is even need to collect primary data (e.g. comparable secondary data sources already exist). Furthermore, it can help with developing appropriate survey instruments that have relevant content and coherent flow. To reduce measurement bias, new survey questions should undergo cognitive testing. Previously validated survey instruments could also be adapted for new information collection activities.
Sometimes, a survey is multi-purpose, with several primary outcomes of interest (and possibly different target populations)14. As a general principle, only the minimum amount of data needed should be collected, and no identifying/potentially identifying information should be assessed, except unless it is absolutely critical to the research question. Direct identifiers include any information collected that provides a reasonable basis to identify an individual; examples of such direct identifies include the following 18 categories: name; all geographical subdivisions smaller than state (street, city, county, zip codes or equivalent geocodes, except for initial 3 digits of a zip code); all elements of dates, except year; all ages >89 years (unless aggregated into single category of age >90 years); telephone and fax number; email, IP address, URL; social security number/passport number; medical record number; health plan beneficiary number; account number; certificate license number; vehicle identification number, device identifiers, and serial number; full face photographs, biometric identifiers; and any other unique identifying number, characteristic or code15,16. Institute Review Board approval should be sought when direct identifiers or potentially identifying information might be needed or possibly collected; at all times, adequate access controls should be implemented to safeguard protected records (Table 1).
Table 1
Access controls necessary to ensure protection of participant privacy
The target population of the survey
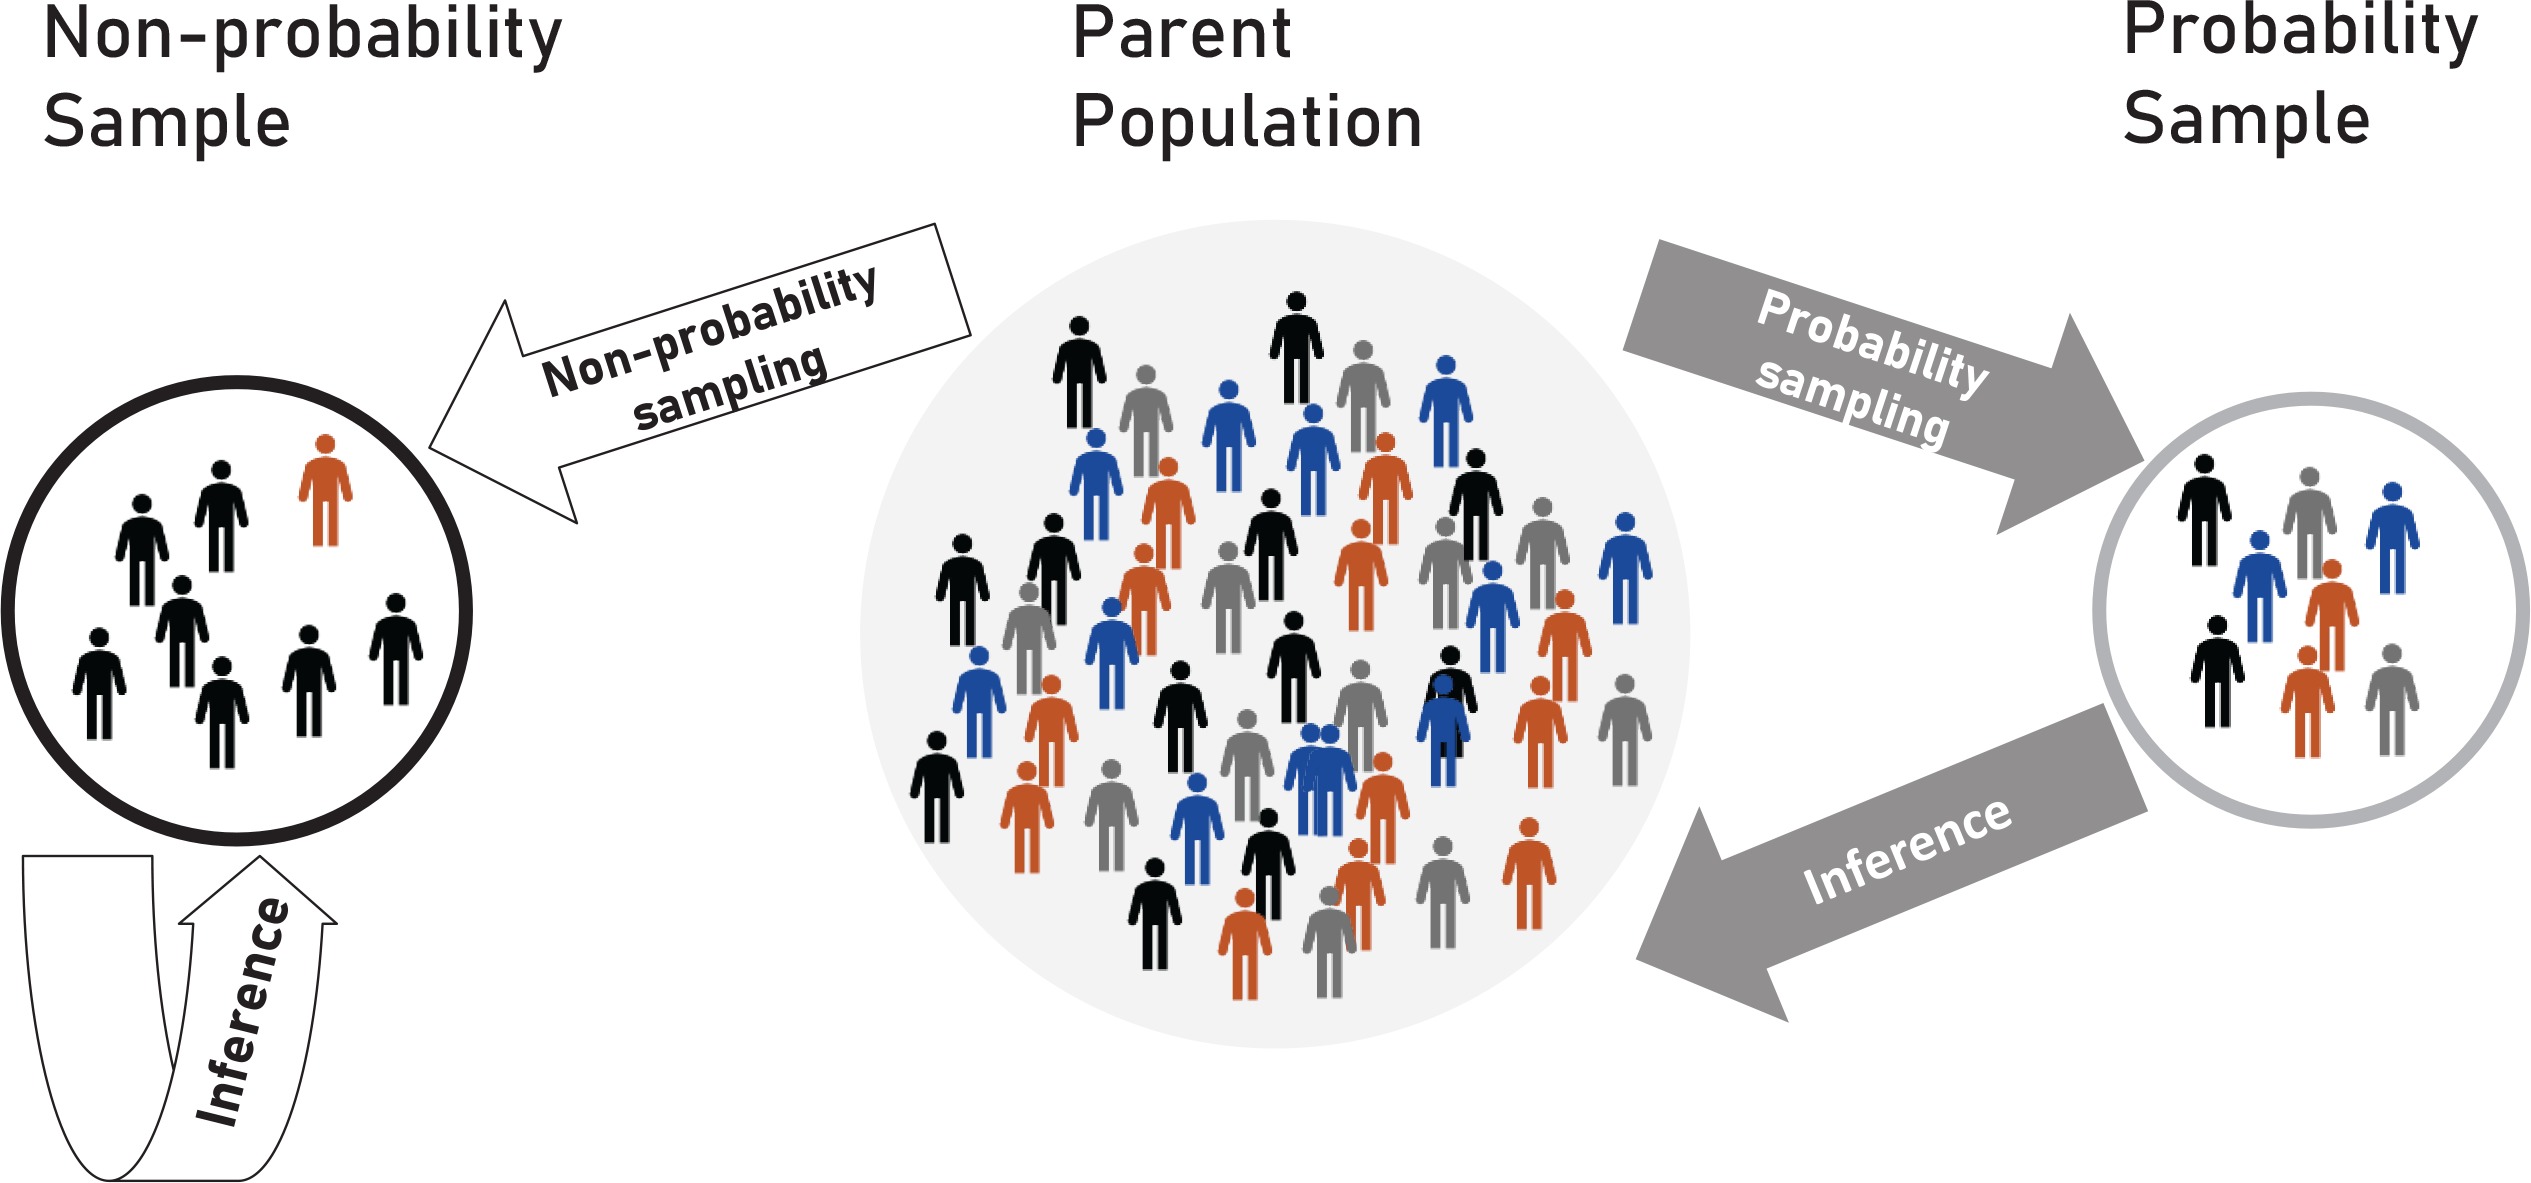
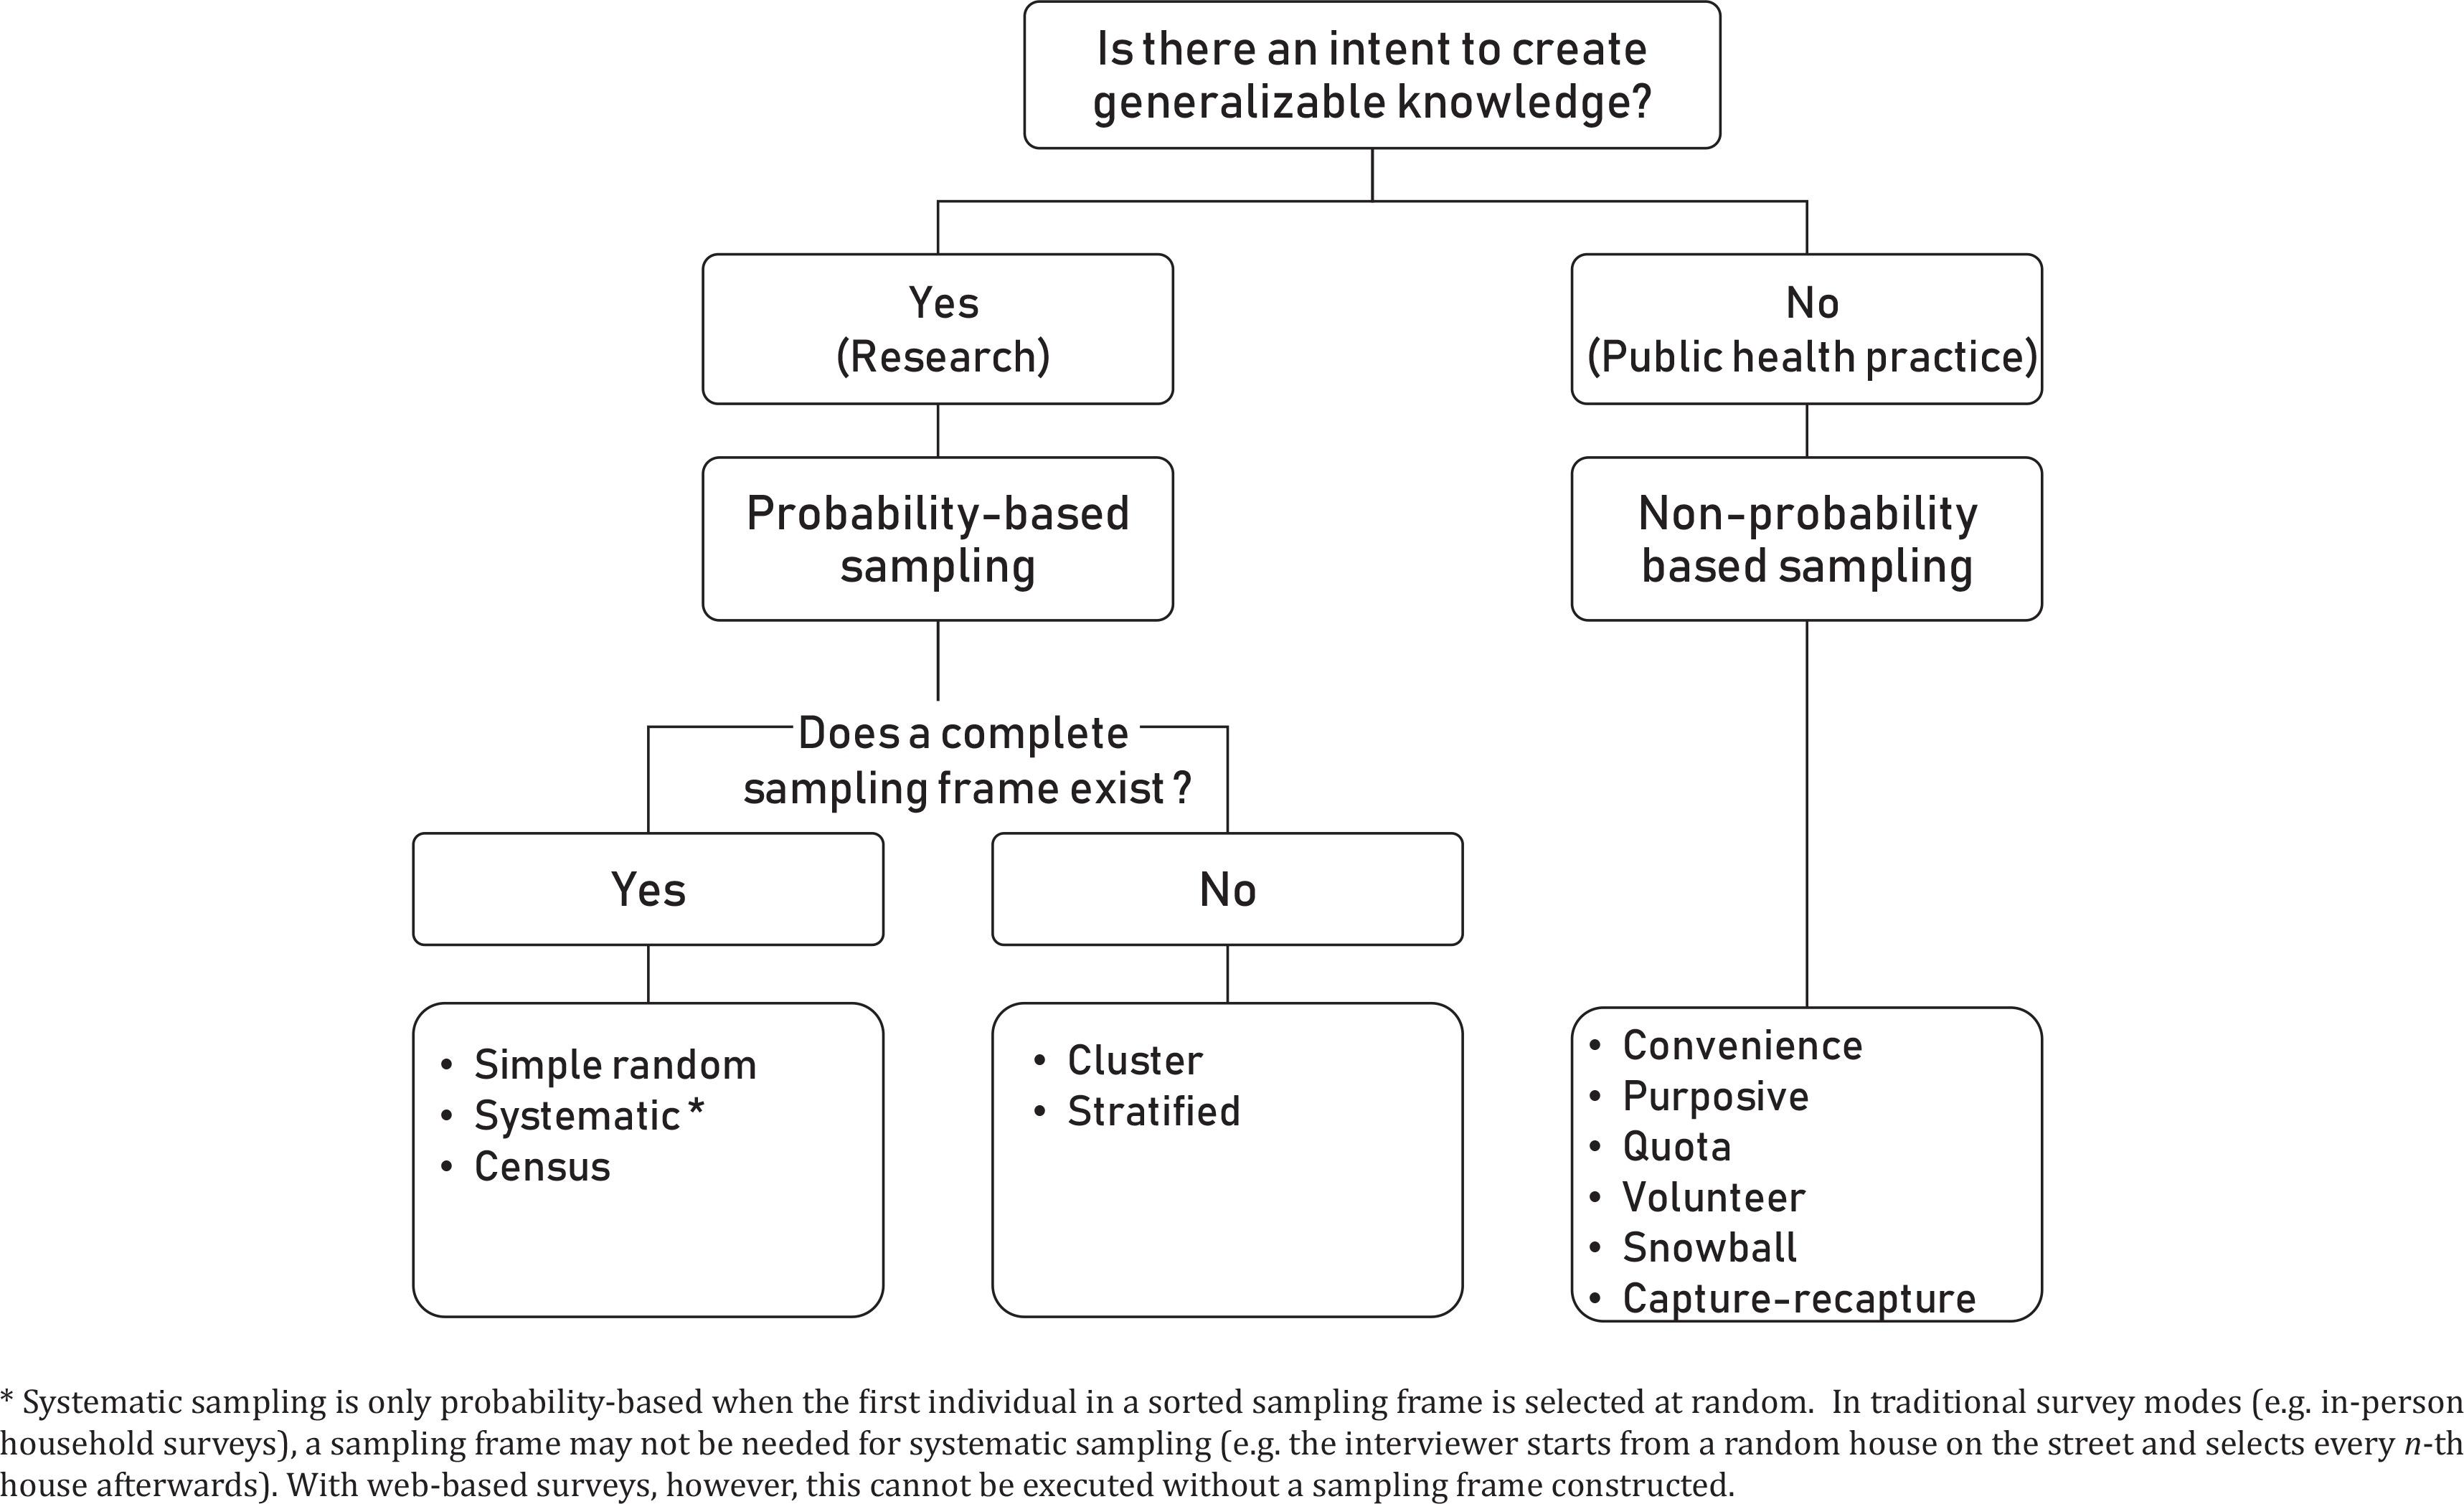
Failure to properly define the target population from which the sample is being drawn could create challenges with making inferences from the sample back to the target population (Figure 1). The target population is determined by the purpose for which data are being collected. In public health, data collection activities are generally classified as either research or public health practice, based on intent to create generalizable knowledge17,18. Research activities (e.g. population surveys) have an intent to generalize findings from the studied population to the larger target population (Figure 2). In contrast, activities deemed as public health practice (e.g. focus groups) have no intent to generalize findings beyond the immediate participants studied; the studied population therefore is the same as the target population.
In research activities, the target population could be defined on the basis of different factors, including geographical (e.g. a county), population (e.g. children), administrative (e.g. program directors), occupational/vocational (e.g. employees or students), or facilities (e.g. clinics). It could also be defined by an event (e.g. birth, death, diagnoses, survivorship, immigration, or emigration), or a behavior (e.g. current tobacco use). Regardless of the criterion used, the epidemiological concepts of person, place, and time should be used to frame the target population. The presence of several target populations within the same survey might have implications for questionnaire design (skip patterns) and sample size calculations (minimum sample size needed).
CASE STUDIES OR PRACTICAL EXAMPLES
Survey population
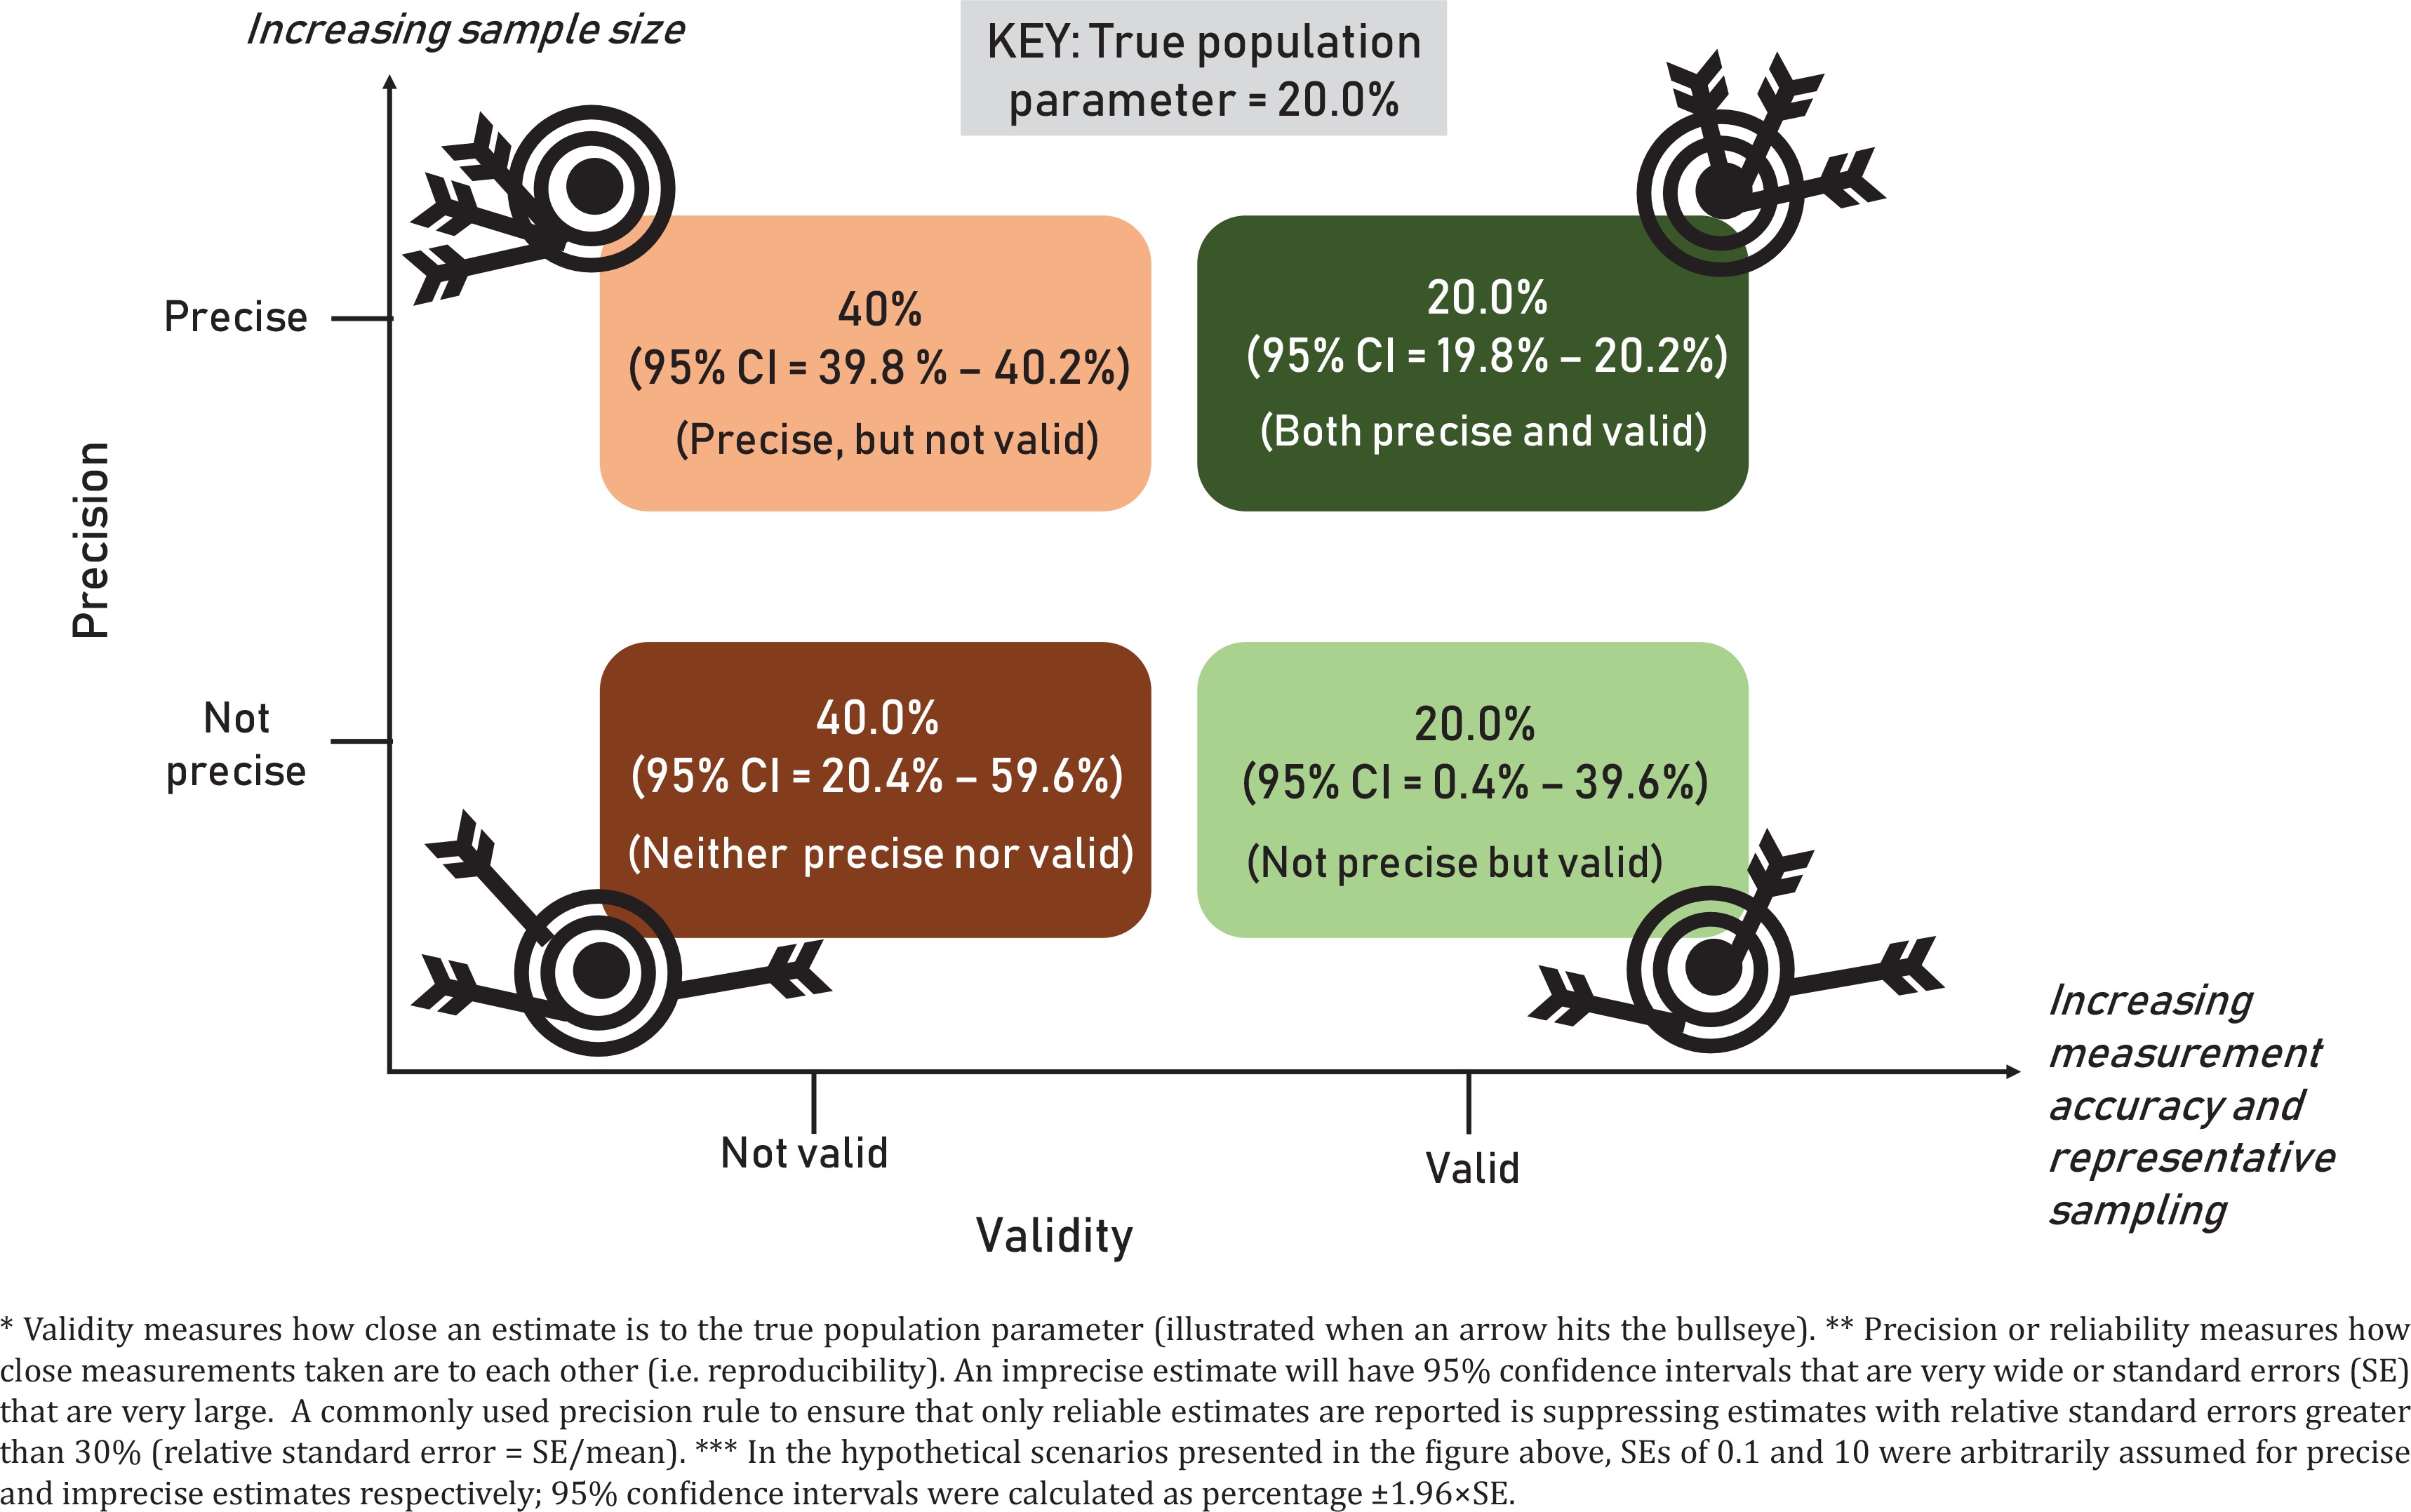
This item touches on issues of precision; a large sample is more precise than a smaller sample (Figure 3). The fundamental approach to sample size calculation does not differ between web versus traditional survey modes; however, more stringent assumptions may be needed for web surveys (e.g. smaller anticipated response rate). Questions which investigators might grapple with during sample size calculations include: ‘How do I ensure that I can generate reliable estimates for the smallest-sized subgroups of interest in my study?’; ‘What if I have several outcomes or target populations within the same survey?’; ‘How do I determine reasonable estimates of the different parameters needed for sample size calculation?’.
Figure 3
Four hypothetical scenarios demonstrating differences in validity* and precision** using an arbitrarily chosen population parameter (i.e. ‘gold standard’) of 20% for prevalence of an unspecified outcome***
The following principles are applied when performing sample size calculations:
When several key outcomes are being assessed (e.g. a multi-purpose survey), sample size could be computed for each key outcome, and the largest sample size used. Alternatively, a prevalence of 50% could be used to maximize yield.
When there are multiple target populations being assessed within the same survey, sample size calculations should be based on the smallest one to ensure that there is adequate precision for the other target population(s).
When there are multiple tabulation variables (e.g. sex, race/ethnicity, and census region) and there is a need to ensure precise estimates for all cells of all variables, sample size should be based on the smallest base population (the smallest category of the tabulation variable with the most levels). A cautionary note, the tinier the smallest base population for which reliable estimates are being sought, the larger the sample size that would be needed.
Domains/explicit strata (usually chosen based on subjective criteria) increase sample size by a factor of the number of domains. Investigators should therefore give careful thought in treating levels of a given variable as domains because of the multiplicative effect on sample size.
Use of clustered sampling rather than a simple random sampling increases the sample size by a factor called the design effect to correct for intra-cluster correlation. The different parameters and assumptions needed for sample size calculation, including typical values, are discussed in Table 2.
Table 2
List of different parameters needed for sample size calculation and their commonly assumed values
Sample size calculation is not needed if one performs a complete census of all individuals listed in the sampling frame. The decision to do a census rather than take a sample can be considered in light of the low response rates typical of web surveys, and also given the fact that the incremental cost of recruiting or contacting an additional participant in a web survey is negligible. When a complete census is taken rather than a sample, there are no associated sampling errors, and hence confidence intervals are not warranted when reporting point estimates (confidence intervals are similarly not scientifically justifiable for non-probability samples because there are no sampling errors either).
Sampling or selecting the participants in a representative manner
This item deals with issues of validity; a probability based sample (e.g. simple random sample) is more valid than a non-probability based sample (e.g. convenience sample). A non-probability sample is so named because selection probabilities are unknown and cannot be numerically calculated for each eligible individual14. The underlying basis for probability, i.e. randomization, is absent in non-probability samples; people opt in or opt out willfully and deliberately (e.g. volunteer samples where individuals self-select into the study, convenience samples where remote or inaccessible units are deliberately ignored by the investigators, or snowball sampling where existing participants recruit new participants from their own network). Selection probabilities could therefore be zero for certain eligible individuals in a non-probability sample. With probability based samples on the other hand, selection involves randomization; selection probabilities are therefore known, non-zero, and numerically calculable for everyone in the study since both the numerator (respondents) and the denominator (all those eligible) are well defined, positive integers.
While a plethora of non-probability web-based data collection activities exist and do have their role in public health practice (e.g. focus groups, semi-structured interviews, volunteer survey panels)19-21, probability based sampling is central to inferential surveillance activities. Any one of the numerous approaches to probabilistic sampling (Figures 1 and 2) will theoretically yield valid estimates in the absence of coverage and non-response biases. If a simple random or systematic sampling will be conducted within the context of a web survey, an important first step is to construct a sampling frame — a list of all the sampling units in the study universe, from which the sample will be drawn. Efforts should be made to ensure that the sampling frame is current, correct, and complete.
Sending the survey invitations in a manner that is efficient, safe, and mitigates bias
Sending large-volume survey invitations en bloc via regular email is likely to get flagged as suspicious or malicious activity and blocked by anti-virus software, internet service providers, or corporate mail administrators22. In particular, the use of the ‘To’ ‘Cc’ or ‘Bcc’ features of emails to invite multiple individuals within the same email should be discouraged as this might lead to unfavorable response rates because of being perceived as spam, or triggering ripple unsubscribe requests. Investigators could use a program with features that allow for batch mailing, customizing delivery to each recipient (e.g. ‘Dear John Q. Public’ instead of ‘Dear participant’), and tracking those who have not responded (to send targeted reminders). Several commercial and open access programs exist for data collection with varying capabilities, including RED Cap (Research Electronic Data Capture; https://www.project-redcap.org/); Epi Info Web Survey (https://www.cdc.gov/epiinfo/cloud.html); Survey Monkey (https://www.surveymonkey.com/); and Google forms (https://www.google.com/forms/about/). A determination of in which environment to host data collection should include a careful consideration of data volume (i.e. total number of respondents), variety (e.g. text-only vs photo/video illustrated questions), vulnerability (e.g. sensitive information and direct identifiers), cost, as well as the software’s capabilities (e.g. security controls, ability to implement skip patterns and to filter respondents and non-respondents). Survey administrators should pre-test the survey application on different devices (e.g. computers, smartphones, and tablets) and using different browsers/browser settings to ensure optimal display across different platforms. Skip patterns, when used, should appear seamless with no apparent discontinuation in the ordering of question numbers from the survey taker’s perspective to reduce potential for confusion; alternatively, the entire questionnaire could be unnumbered.
Whenever possible, customized links should be provided for each participant to ensure that each email invitation can only be completed once and by the intended recipient. When only a generic link exists where anyone who has the link can access the survey, recipients should be discouraged from forwarding the survey to any other person. If individuals not in the sampling frame were to be forwarded the survey and complete it, the probability based attributes of the survey begin to get eroded and the survey begins to assume characteristics of a snowball (non-probability) sample.
The consent process could be administered in the introduction page of the web survey; it should be clear to participants that proceeding with the survey indicates that they understand the purpose of the study and agree to participate. The survey team’s contact information should also be provided in the introduction page for participants to send questions or concerns about the survey. Completed responses from study participants should be fully delinked from their email or cell phone numbers. Where direct or potential identifiers are being collected, all responses completed online should be done in a secure, electronic, web-based data collection system hosted within an infrastructure where the survey administrators have full control of the data. The survey should have an opening and closing date, after which responses will no longer be recorded. After the survey closing date, data should be transferred from the Server database into a flat database and stored on secured, password protected computers where they will be accessible only to the investigators.
When financial incentives are being used to increase response rates, care should be exercised in the amount offered so that no selection bias is introduced inadvertently (e.g. differential participation rates by individuals of low and high socioeconomic status). Consideration should also be given to the timing of web survey launches and follow-up reminders to ensure optimal response rates. For example, inviting academic faculty or students to complete a web survey during periods of peak school activity (e.g. exam periods) might yield low response rates.
Assessing and enhancing the external validity of collected data
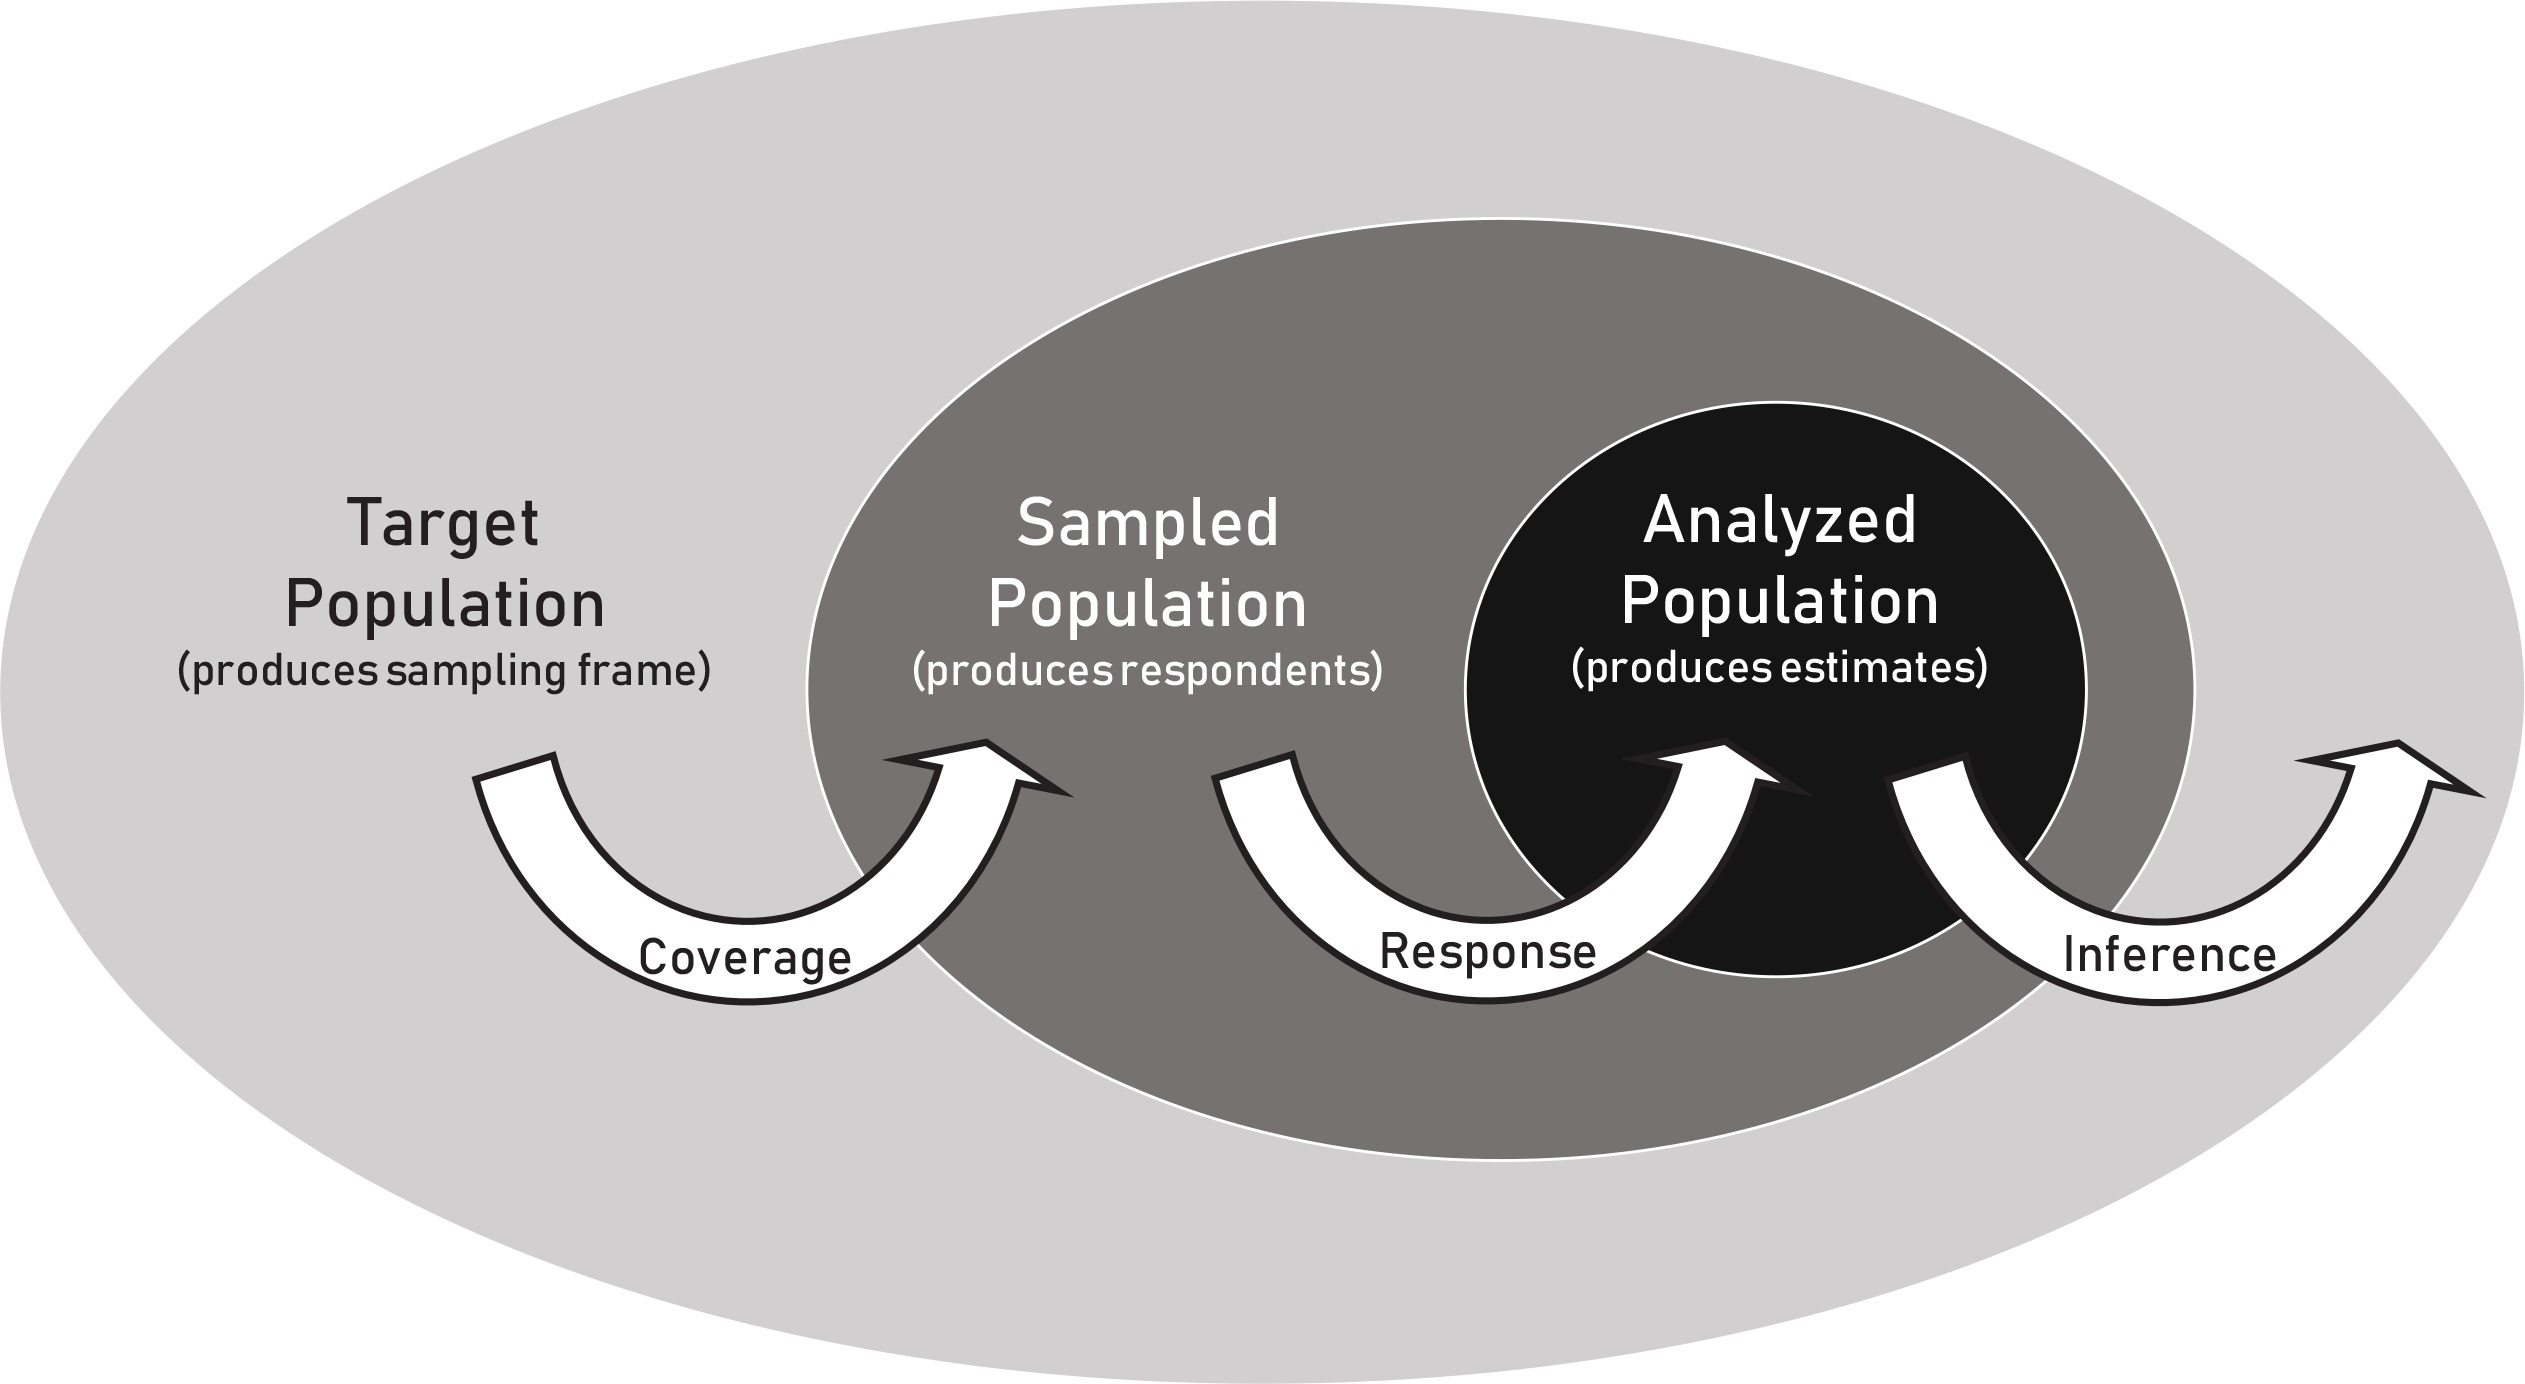
Two threats to external validity or generalizability in a web survey are poor coverage and low response rates (Figure 4). Poor coverage occurs when the sampling frame does not cover the entire target population. When significant coverage bias exists, a mixed mode survey could be implemented to increase the extent of coverage; for example, a traditional survey mode (e.g. telephone, postal mail, or face-to-face surveys) could be added to the web mode to ensure that everybody in the target population has a known, and non-zero probability of selection. Alternatively, the study population could be redefined (narrowed) such that the areas of non-coverage are excluded.
Testing for non-response bias is especially important in web surveys because of the typically high rates of non-response. A validation survey which involves conducting a follow-up survey on a sample of non-respondents, would typically be needed to empirically test differences between respondents and non-respondents. Intensive efforts are often needed to elicit a response from original non-respondents within validation surveys, including use of incentives, using a shortened version of the questionnaire to encourage response, and using additional ways to contact participants, beyond merely emailing, e.g. direct mail, phone calls or in-person visit. Besides helping to detect non-response, a validation survey can help mitigate non-response bias, while also increasing the effective response rate. Several scientific journals will only publish findings from surveys with ‘high’ response rates, as such there is a strong motivation to increase the effective response rate of low-response web surveys.
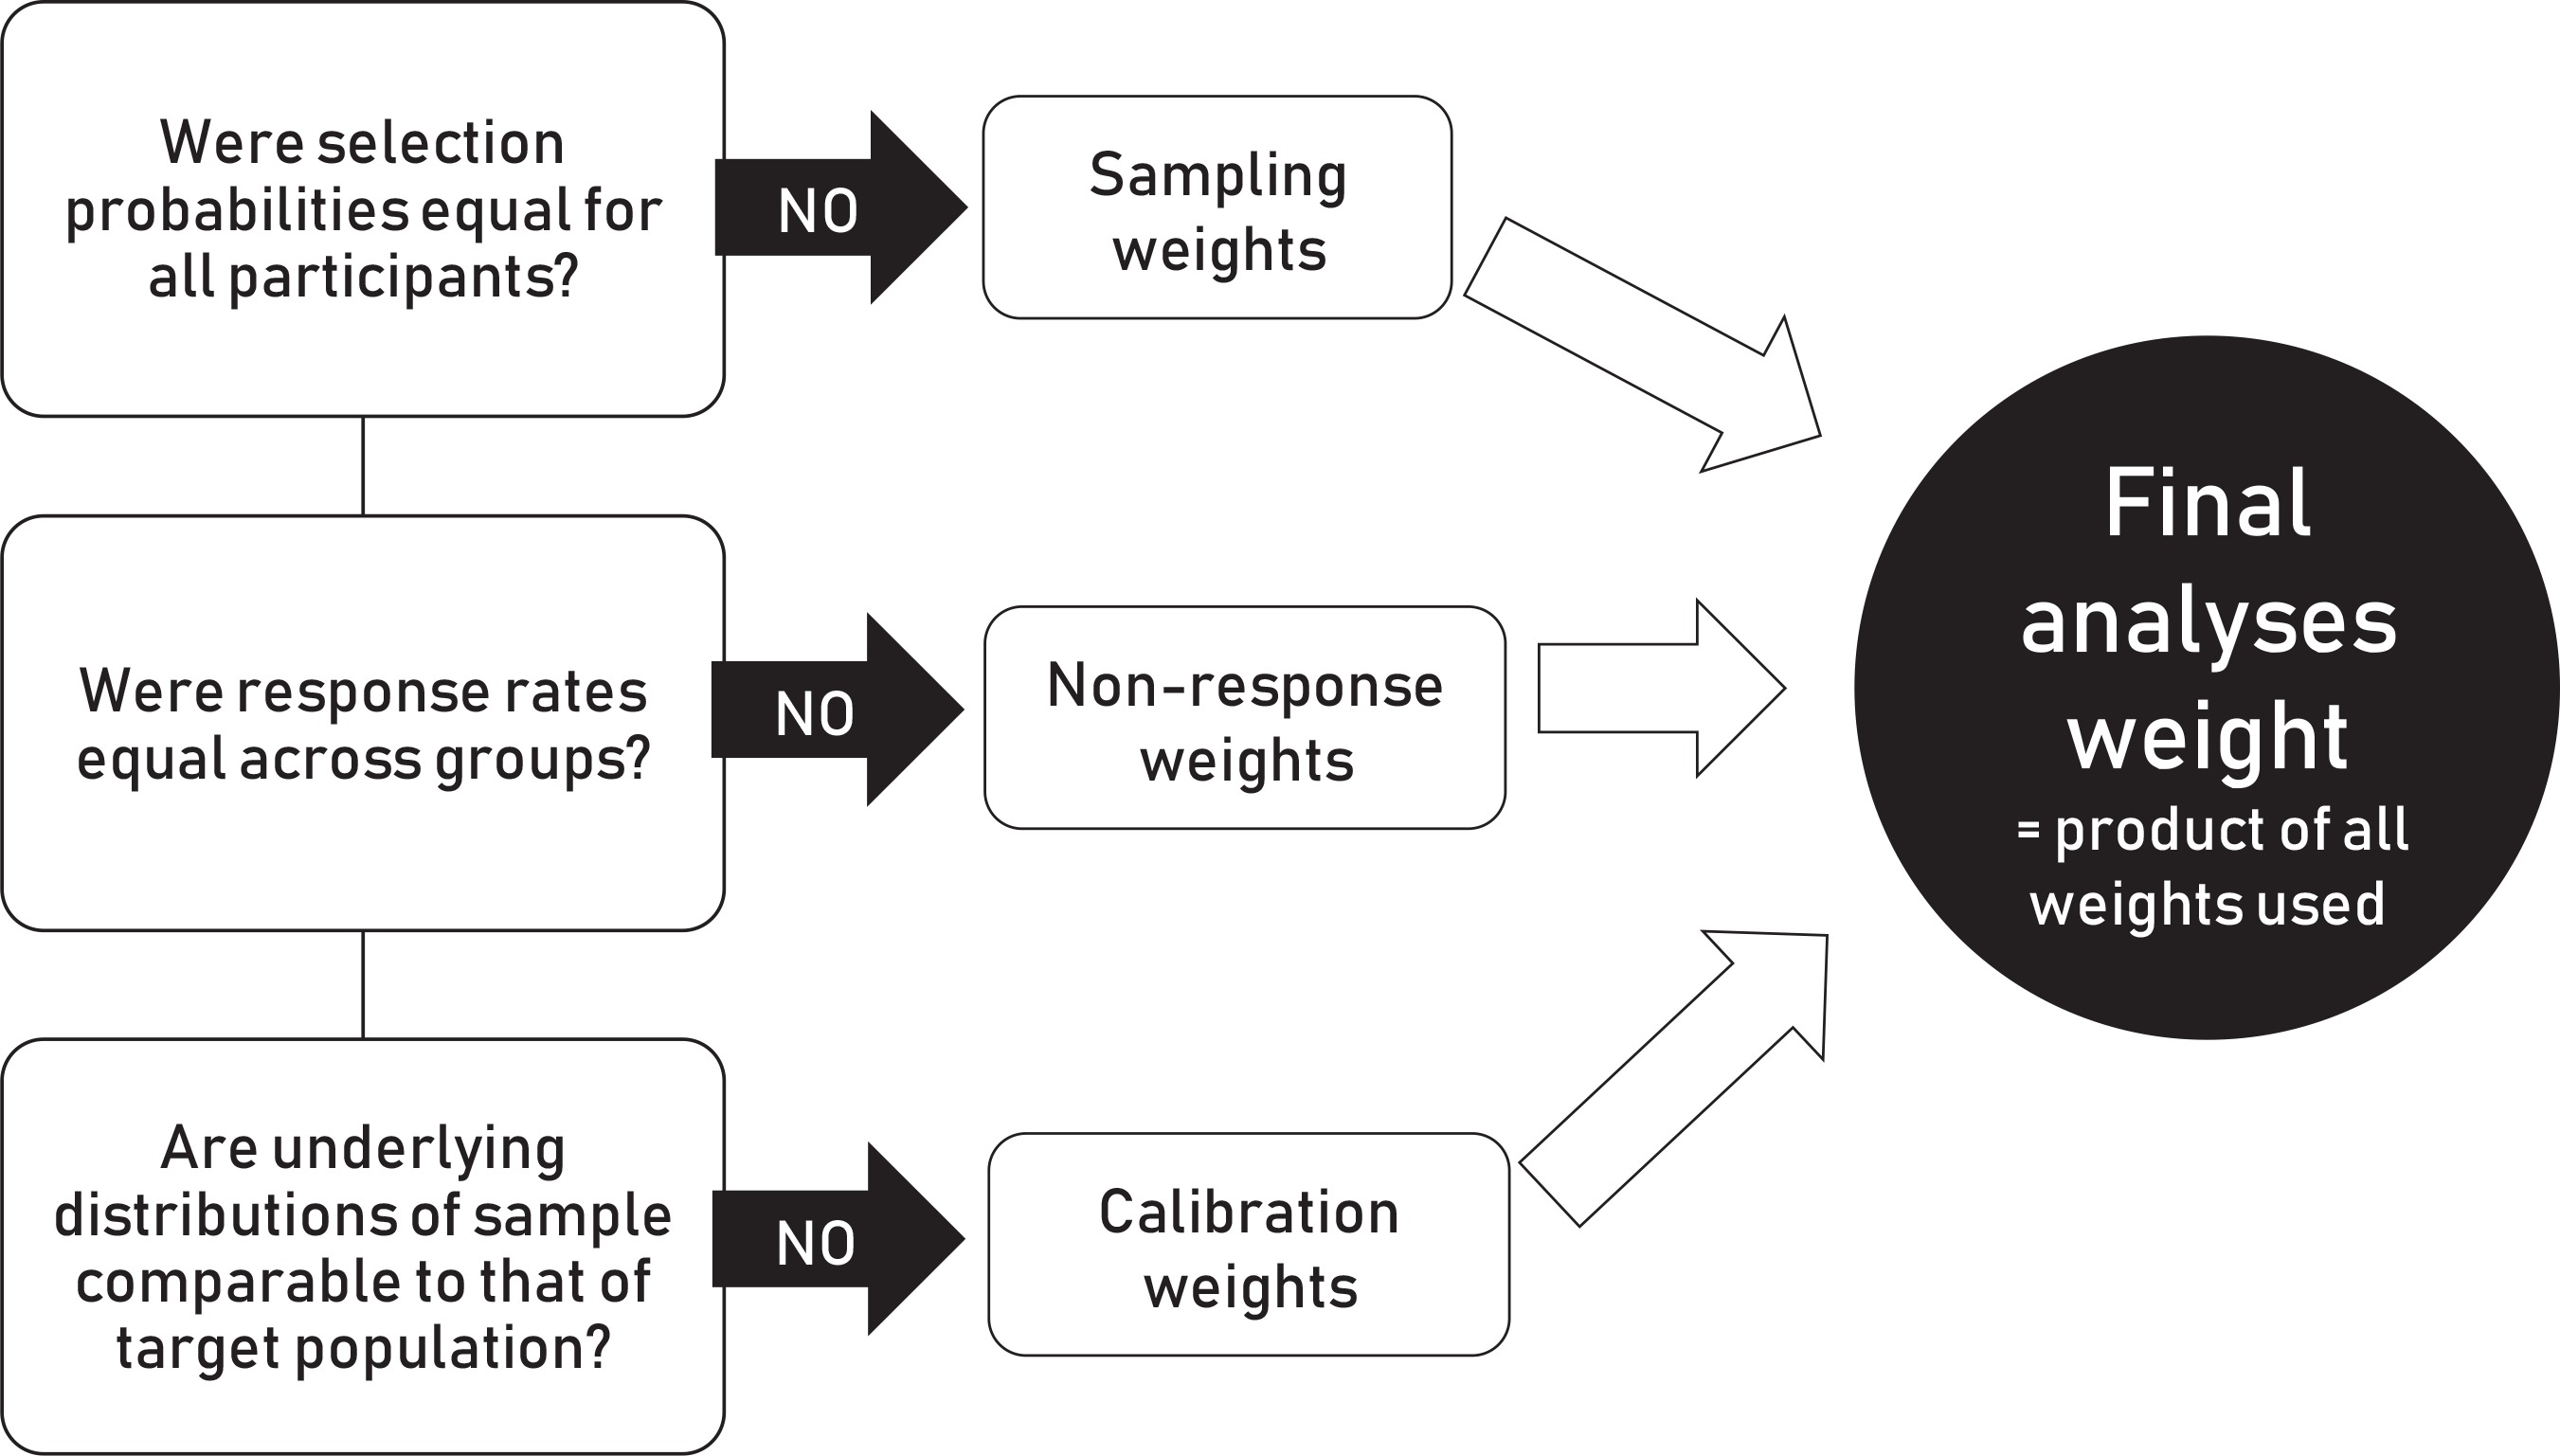
Where necessary, different types of weights, including sampling weights (inverse of selection probabilities), non-response weights (inverse of the response rate), and calibration weights (standardizing the demographic distributions of the sample to that of the parent population) may be used to enhance the external validity of a survey (Figure 5). All, none or a variable number of these weights may be applied depending on sampling approach used, patterns of non-response observed, and the availability of data on sampling frame characteristics. For example, sampling weights only apply when selection probabilities are differential (e.g. oversampling of certain groups); they do not apply when selection probabilities are equal for everyone (e.g. simple random, or systematic sampling). Similarly, non-response weights only apply when non-response rates are differential across groups (i.e. not when all groups have comparably high or comparably low response rates). Calibration weights can only be created when data are available on the demographic distribution of the parent population. The final analysis weight is computed as the product of the individual weights used.
DISCUSSION
Although web surveys in general are becoming increasingly easier to perform, even without formal training in survey methodology, good web surveys in contrast are becoming increasingly harder to conduct (as measured by indexes such as response rate and coverage)7. Nonetheless, web surveys can play an important role in public health by providing a mechanism to surveil trending issues of public health importance in near real-time, for program and policy action. Their flexibility can easily allow incorporation of certain features that may be cumbersome in traditional survey modes, including such features as videos, pictures, and images23.
Determining the purpose for which data are being collected online is an important first step in survey design as this undergirds the assumptions made and defines the nature of the information collection activity23. For example, if the purpose is to perform an online experiment where individuals are randomized to two or more interventions (e.g. different health communication messages) and short-term outcomes such as cognitions and emotions measured, then a volunteer sample could well be used (randomized trials have strong internal validity, but weak external validity because of their non-probabilistic sampling). In contrast, if the purpose is to estimate a population parameter from the sample, then, special attention should be given to issues of generalizability (cross-sectional surveys have strong external validity, but weak internal validity because of temporality bias and measurement errors).
CONCLUSIONS
Careful consideration should be given to sampling and non-sampling sources of error when designing web surveys to ensure validity and reliability. While this article does not discuss several technical issues that are beyond its scope, it nonetheless provides survey design principles, resources, and tools that could assist public health practitioners and researchers when implementing web-based surveys.